Blog
Cost reductions as a response to the end of the commodity price boom
The recent publication of the 3rd edition of ICMM’s The Role of Mining in National Economies (hereafter RoMiNE3) provides us with the welcome biennial review of the global situation as it affects the large mining and metals industry. In addition to its regular update of the Mining Contribution Index (MCI) that the ICMM has pioneered, this year’s publication also affords us an insight into two aspects of the recent ending of the commodity super-cycle that have gone relatively unnoticed. This blog summarises what RoMiNE3 says about the impact of lower commodity prices on the costs of producing minerals. A later blog will comment on the impact of lower commodity prices on new exploration, development and research activity in the industry.
From rising to falling costs
The second edition of RoMiNE published in 2014 discussed factors that had tended to increase production costs, as high metal prices gave the large mining companies considerable headroom to exploit more difficult resources in existing locations or more remote resources elsewhere, and generally to sideline worries over costs.
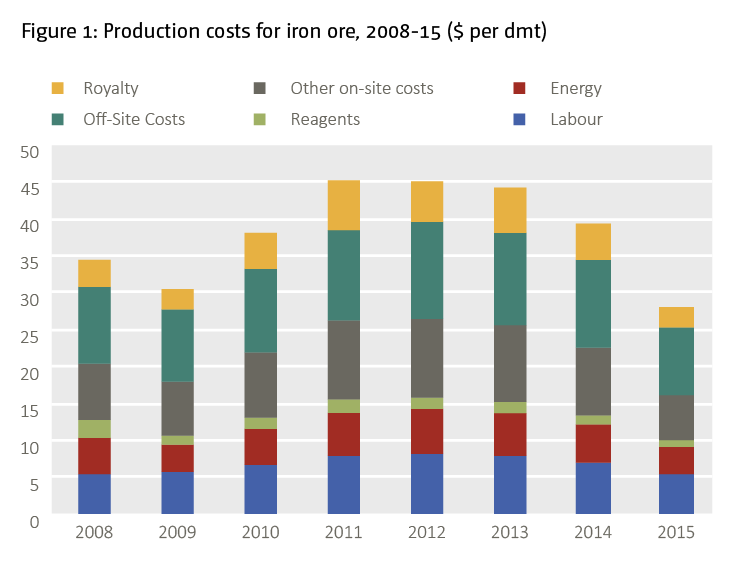
However, this situation has changed radically since prices began to decline in 2011/12. The case of iron ore as depicted in Figure 1 below typifies that change. For iron ore there was a 31% increase in the weighted average costs of production in the boom period 2008-12. But as the Figure shows this increase was sharply reversed in the next three years through 2015 — specifically that period saw a dramatic overall cost decrease of 38%.

Most identified components of total costs contributed something to this overall decrease. But in percentage terms two of the largest decreases were seen in relation to energy costs (a 40% reduction) and royalties (a 48% reduction). Labour costs were also reduced, but only by a smaller percentage extent of 33%. [1] In short, mining companies benefitted from the lower prices of oil and gas inputs, were able to pass a significant part of the pain of lower iron ore prices to host governments (via the lower royalty) but still had to transfer some of the pain to their labour forces.
A different picture emerges for copper and gold mining
In the case of copper there was a 37% increase in productions costs during 2008-12, but this too was partially reversed in the three years through 2015 when there was a reduction in costs of 14% — much smaller than in the case of iron ore. However, in the case of copper easily the largest percentage decrease was borne by royalty payments (a 50% decrease) with the energy cost-saving involving a reduction from 2012 levels of only 16%. Labour costs decreased by just under 20% — significantly less than was the case for iron ore.
In short, the burden sharing of lower commodity prices was different in this case with government bearing a larger part of the total pain. In the case of gold, there was a smaller 11% overall decrease in production costs after 2012 following an extremely large 60% increase between 2008-012. Once again royalty costs saw the largest component decrease in percentage terms (24%) with the energy and labour costs decreasing by 15% and 10% respectively. So once again the governments of host countries took the largest share of the cost-reducing responses to lower commodity prices.
Global variation
The mine-by-mine data available from the database of SNL Mine Economics shows large variations in costs across the world’s many gold mines. Although the average total cost in 2015 was $670/oz, around a quarter of the world’s ‘paid gold’ was produced at a total cost of under $500/oz. At the peak of total costs, in 2012, a significant number of mines (in Australia, Canada, South Africa, West Africa and Papua New Guinea) produced at a total cost in excess of $1,500/oz. The overall cost reduction we see globally after 2012 has been caused in part at least by the fact that by 2015 only a handful of South African mines were still producing at that high level of production costs.
References
ICMM (2014). The role of mining in national economies (2nd edition). Mining’s contribution to sustainable development. October. London: ICMM.
ICMM (2016). The role of mining in national economies (3rd edition). October. London: ICMM.
The views expressed in this piece are those of the author(s), and do not necessarily reflect the views of the Institute or the United Nations University, nor the programme/project donors.
[1] RoMiNE3 itself discusses these component cost decreases in terms of the $ amounts of the decreases. This gives a somewhat different perspective on the relative importance of the various components in the overall reduction of costs. Additionally, many of the major resource exporting countries such as Australia, Brazil and Canada saw their exchange rates appreciate during the price boom period and subsequently depreciate as prices came down, and this has also helped companies to reduce costs expressed in US$ terms.
[2] This is reproduced from Figure 6 in RoMiNE-3 (2016) but the raw data came from the data-base created by the Raw Materials Group of Sweden that was at that time owned by SNL Mine Economics. dmt = dry metric tonne.
 Join the network

