Background Note
Do more diversified suppliers rebound faster than concentrated suppliers in times of shocks?
Insights from Kenya
In this background note, we examine how different firms and sectors rebound or prevail in crises. We draw on insights from the performance (upgrading potential) of Kenyan horticulture, tea, and leather export firms during two recent, but very different, shocks to the Kenyan economy. The first is the 2008 global financial crisis, which was accompanied by domestic election violence. The second is the 2011 drought, further compounded by an export ban to the European Union (EU) for vegetables exceeding legal levels of pesticide concentration; also known as the ‘Maximum Residual Levels (MRLs) crisis’.
Analysis of the impact of these heterogeneous shocks on Kenyan export firms sheds light on sector-by-sector patterns of recovery and provides valuable foresight for the ongoing COVID-19 pandemic.
We unpack two critical questions. Do more diversified suppliers that sell into multiple end markets recover faster (or differently) compared to concentrated suppliers that depend on specific end markets? Is there any recurring recovery pattern across Kenyan suppliers across different sectors?
Despite both shocks being very different from each other in origin, Kenyan export firms showed similar patterns of robustness (‘the ability to maintain operations during a crisis’) and resilience (‘the ability to return to normal operations over an acceptable period of time, post-disruption’). The results indicate that diversified suppliers performed comparatively better among tea and horticulture exporters and proved to be more resilient and robust than concentrated suppliers. This dynamic suggests that speedier recovery stems more from an export strategy of end-market diversification than the nature of the shock itself. However, the leather sector proved to be an exception, as concentrated suppliers were more resilient instead.
Our study has obvious policy implications for governments seeking to shore up their export industries and increase international competitiveness in the wake of an economic shock, such as the ongoing COVID-19 pandemic. It indicates that a small set of readily available indicators (drawn from customs data) can be highly explanatory for decision-makers seeking to understand the unique aspects of key export industries and formulate policy to support their recovery in times of crisis. We argue that future studies of a similar nature can make a valuable contribution to the literature on industrial competitiveness and globalization in the time of shocks, and be relatively straightforward and inexpensive to carry out.
What about low-income countries?
Numerous grim headlines cover the news concerning the disruptive effect of the COVID-19 pandemic on the future of GVCs. These range from the Financial Times asking ‘Will coronavirus pandemic kill off global supply chains?’, to The Telegraph’s piece ‘The end of globalisation? The herculean task of decoupling supply chains from China’. A significant chunk of these arguments focuses on the importance of reducing dependence on specific countries for imports (especially medicines) and gaining national self-sufficiency.
These articles have in common a combined emphasis on: (a) high-tech manufacturing and the service sectors in the Global North; and (b) long value chains with a considerable number of intermediary products and a high degree of specialization. Conversely, they neglect relatively shorter and less-specialized value chains in low-income countries. Notably, these sectors include agriculture and light manufacturing sectors, such as apparel and leather, which are often central to the export strategies of developing and least developed countries.
Kenya’s export-oriented industries
In this note, we focus on three key export-oriented sectors in Kenya. The first, horticulture (including fresh and processed fruits, vegetables and nuts (FFV)) and tea are among the largest of Kenya’s export sectors, accounting for over 30 per cent of the country’s total exports in 2019. Historically, high-value FFV was first introduced to Kenya in the early 1900s, when White settlers founded the East African Agricultural and Horticultural Society. By the 1960s, Kenya was receiving large inflows of foreign direct investment (FDI), especially in pineapple production, with investment spearheaded by firms like Del Monte. These FDI flows supported the introduction of new crops and technologies. Furthermore, indigenous varieties of mangos (e.g. Batawi), avocados (e.g. G6 and Pueble) and garden peas were replaced by export varieties destined for Europe (especially the UK), such as apple mangos, Haas avocados and Ambassador peas.
Similarly, new products that were not indigenous to Kenya, such as green beans and snow peas, were introduced in the mid-1970s–80s. This laid the foundation for the export-oriented nature of the sector, serving developed economies. Presently, the horticulture sector is dominated by small-scale producers at the upstream end of the value chain, which funnels into a relatively large number of mostly small and medium-size export firms.
The origins of tea in Kenya have parallels with horticulture. Tea was first introduced by British traders in the early 1900s. Over time, with the institutionalization of the Kenyan Tea Development Authority (KTDA), the tea sector became a highly co-ordinated and controlled value chain, dominated by a few large exporters. Many of these firms are transnational corporations, such as Unilever and Tetley. Over 60 per cent of the country’s total tea production is carried out by smallholder farmers who sell their tea through KTDA and other out-grower schemes co-ordinated by export firms. Tea is the main export crop for Kenya, accounting for about 30 per cent of the country’s total exports in 2019.
Leather is also a long-standing industry in Kenya, dating back to 1905 when the industry was kickstarted to promote the export of game-trophies and vegetable tanned leather for the British Empire. Following the end of an import substitution regime and the government’s introduction of a structural adjustment programme in the early 1990s, the sector practically collapsed. Since 2006, export promotion policies have supported the growth of the sector, making it the second largest (after Ethiopia) exporter of semi-processed hides and skins in the Common Market for Eastern and Southern Africa (COMESA) region and the largest producer of leather goods (excluding footwear). In terms of its structure, the leather sector is somewhere between tea and horticulture, with a small number of large exporters (especially for semi-processed leather) along with multiple small enterprises producing a range of leather products for domestic and export markets. Although it accounts for a small share of Kenya’s total exports, leather is a sunrise sector, and is central to the country’s long-term industrialization strategy.
Resilience and robustness of global value chains
Unpacking value chains enables digging down into the heterogeneity across sectors and products. Some value chains are likely to recover or rebound faster than others. According to Miroudot (2020) ‘resilience’ is defined as the ability to return to normal operations over an acceptable period of time, post-disruption. Conversely, Brandon-Jones et al. define ‘robustness’ as the ability to maintain operations during a crisis and continue to perform ‘at least at the same level as prior to the shock’. The key outcomes of resilience and robustness during shocks can be understood through firms’ performance.
Scholars of global value chains (GVCs) generally link firms’ performance to the critical concept of ‘upgrading’. GVC scholars have defined ‘industrial upgrading’ as ‘the process by which economic actors — firms and workers — move from low-value to relatively high-value activities in global production networks’. There are multiple ways for a sector or firm to upgrade. This can occur (i) by shifting to greater product variety and updating old products (product upgrading); (ii) by re-organizing production to transform inputs through superior technology (process upgrading); and (iii) by shifting to higher value-added functions in the chain (functional upgrading) (Humphrey and Schmitz 2002).
Building robustness and resilience requires different strategies at the firm- and sector-level to promote upgrading. A key strategy is geographic diversification, broadly understood as a firm’s market expansion ‘across the borders of global regions and countries into different geographic locations, or markets’. Scholars argue that multinational firms opt for geographical expansion over co-location of their global business processes to reduce the ‘hazard of knowledge misappropriation’. Kramarz, Martin, and Mejean (2020) also show that exporting countries, especially during idiosyncratic shocks, have significantly higher volatility due to a lack of geographic diversification or increased over-dependence a few markets.
Alternatively, firms may deploy concentration strategies — that is specialization in serving specific end markets (see Crick et al. 2000; Katsikea et al. 2005). Studies have shown that long-term advantages of concentration include accelerating accumulation of complex knowledge, formation of stronger networks and information sharing, and engendered product diversification over time (for example, Aspelund et al. 2007).
Geographic diversification and concentration in GVCs has gained relevance only in the last decade as scholars started unpacking these strategies and their implications for ‘producers who supply multiple global and regional lead firms’. Most of these studies broadly regard geographic diversification as a passive strategy based on past experience, trading history, and, more simply, lack of alternatives. For instance, Pickles et al. (2016) and Blazek (2016) argue that, in some cases, suppliers withdraw from selling to retailers in the Global North in favour of Southern end markets with comparatively less stringent standards and lower entry barriers. Their strategy is therefore underpinned by an attempt to minimize losses. In other cases, scholars have described geographical diversification driven by firms’ opportunistic behaviour. For instance Barrientos et al. (2016) and Navas Aleman (2011) suggest that Kenyan, South African, and Brazilian suppliers in the horticulture and footwear value chains attempt to strategically diversify away from GVCs and participate in multiple-value chains simultaneously, to reduce dependence on one market.
However, evidence comparing concentration and diversification strategies and their impact on firms’ resilience and robustness to shocks is surprisingly limited, especially for export-oriented sectors. Some support the view that more diversified firms are better suited to withstand shocks as they ‘reduce supplier-specific and country-specific risk’. While others, including a report by the World Bank following the 2008 downturn, contend that crises bring about consolidation of GVCs as lead firms liaise with fewer suppliers. Overall, the available research does not account for different sectors’ resilience or robustness patterns throughout crises, and under what conditions a strategy of geographic diversification is preferable to single end-market concentration. In the remainder of this note, we draw on customs data for Kenyan horticulture, tea, and leather sectors to explore these dynamics.
Analysing Kenyan firms’ exposure to past shocks
Due to COVID-19, the IMF has downgraded Kenya’s economic growth prospects for 2020 from 6.2 per cent to 1 per cent. As the Kenyan economy has been badly hit during the COVID-19 pandemic, analysing the impact of previous shocks on the country’s core sectors can help us draw important lessons on how to tackle the ongoing crisis.
The big shocks that Kenya experienced in the previous decade are in fact very different in nature. The difference between the 2008 global financial crisis, which was compounded by domestic violence linked to the country’s general elections, and the 2011 localised shock of one of Kenya’s worst droughts and concurrent trade suspension of horticultural exports, is not just geographical. It further rests on the underlying causes of these two shocks. On the one hand, the financial crisis was primarily driven by a collapse in demand, while on the other hand the 2010–11 MLRs crisis and the regional drought were a supply shock that disrupted production. Today’s ‘Great Lockdown’ is a combination of the two, characterised by a ‘rare twin supply–demand shock’ when a supply constraint is accompanied by a simultaneous shock to demand. Looking at the 2008 and 2011 crises in combination can help us understand what the recovery years 2021 and 2022 may look like, in terms of robustness and resilience for exporting firms.
Using transaction-level customs data, we disaggregated the impacts on diversified and concentrated firms for both shocks. We relied on a dataset of 1,349 horticulture exporters, 354 tea exporters, and 741 leather exporters over an eight-year period (2006–13). The results are fully representative as they cover the complete universe of exporting firms for each sector. In the analysis, we take a 4-year timeframe for each of the two crises. This allows us to monitor suppliers’ performance in the year before the crisis (which is set as a benchmark), the change that occurs in the year of the crisis, and the possible rebound over the following two years.
The data is indexed, with the pre-shock year to 100. The analysis focuses on three firm-specific indicators, which are commonly used to explain levels of firm upgrading:
- Firms’ average revenue freight on board (FOB). Changes in a firm’s total exports for a given sector is an indicator of business performance.
- Product count, indicating firms’ average number of exported products. An increase in ‘related product diversification’ across products within the same sector has been associated with increased business performance and competitive advantage.
- Product sophistication, indicating whether the quality and complexity of products changed using Hausmann’s product groups. An increase in product sophistication over time has been previously associated with upgrading.
Results
Horticulture: financial crisis and election, 2007–08
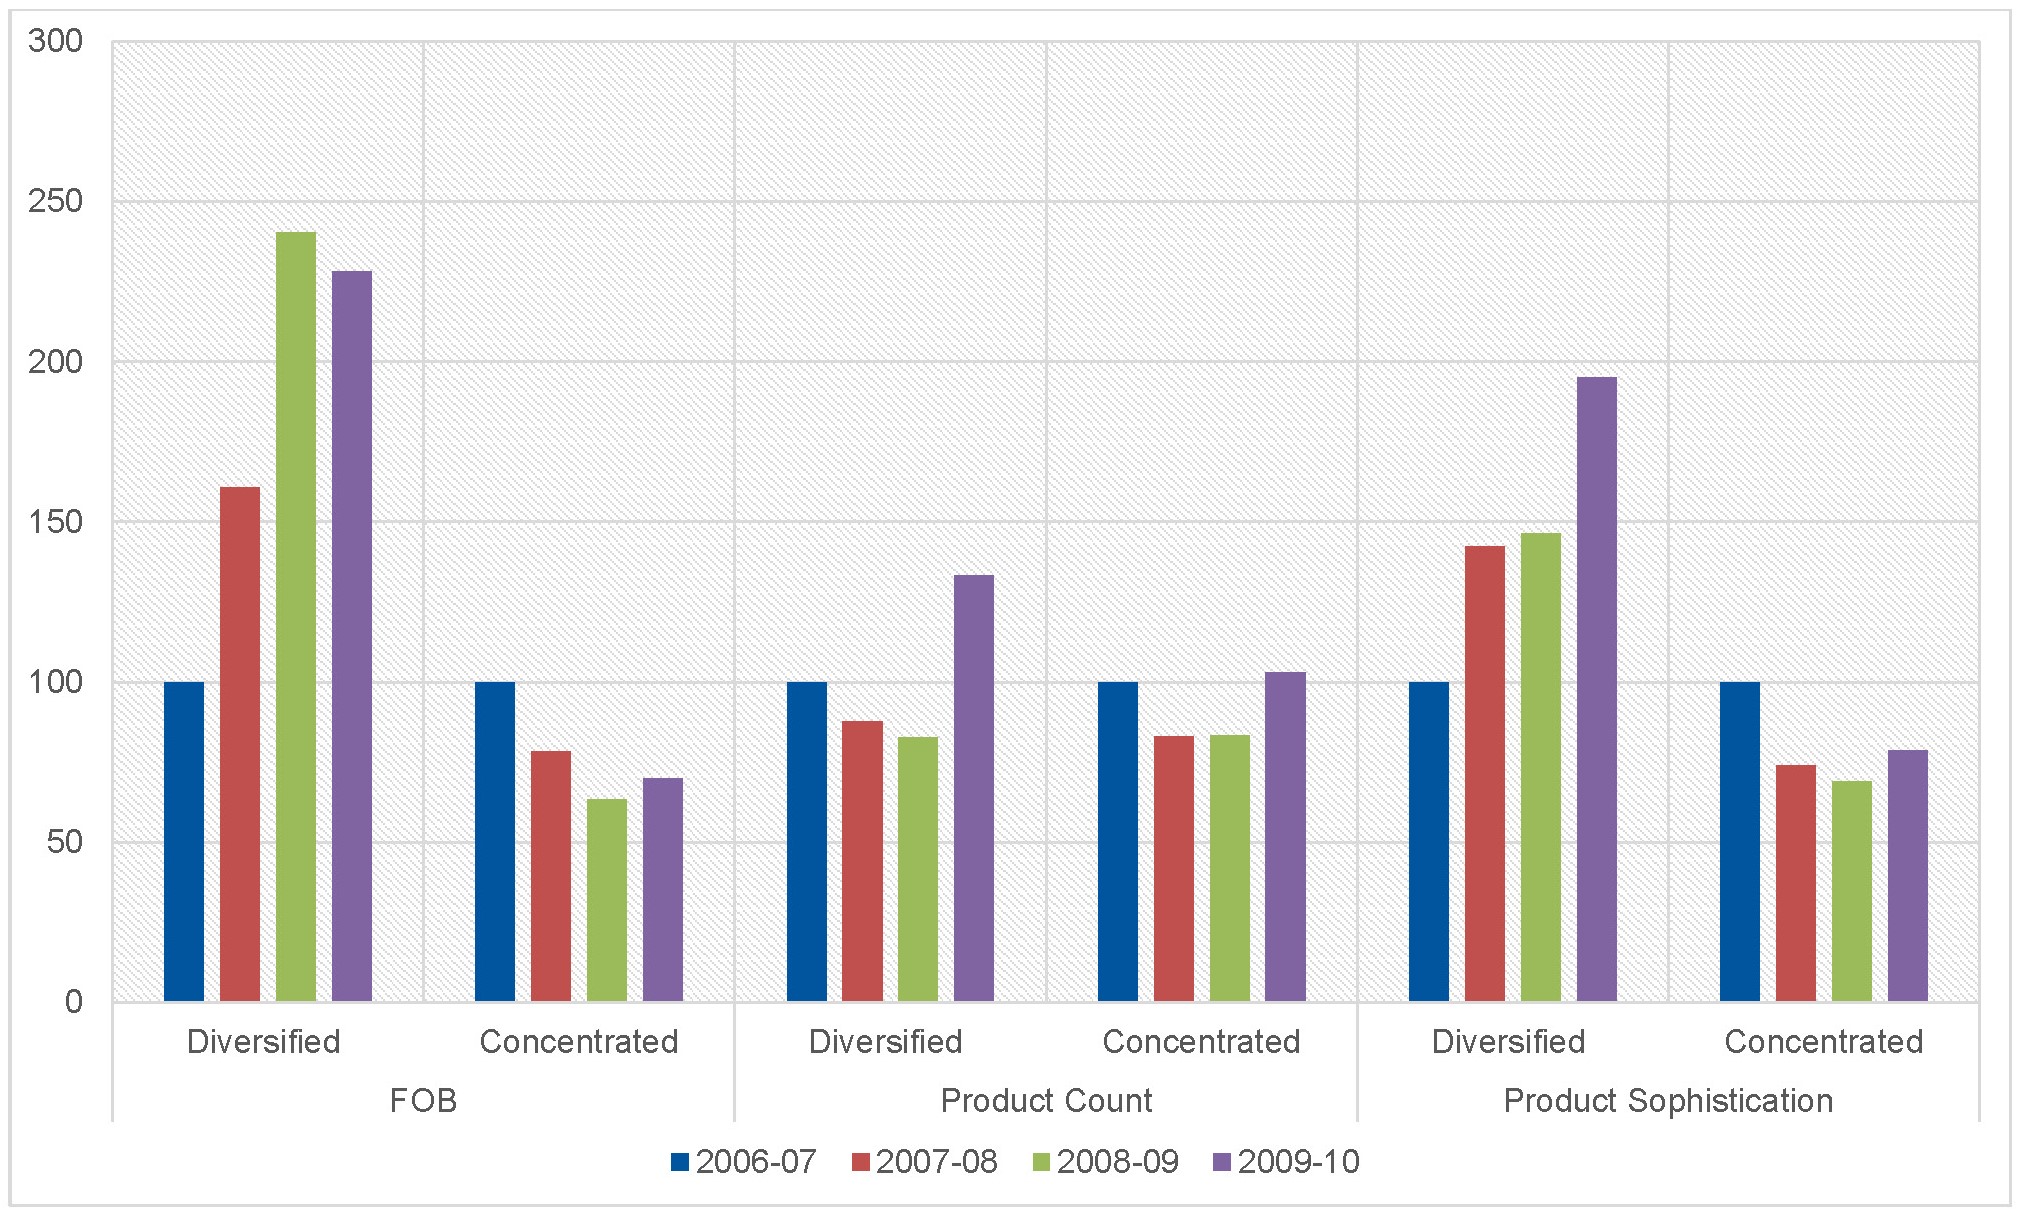
For horticulture, the average FOB of diversified firms constantly increased during and after the crisis, while concentrated firms saw a continuous decrease. Product count fell steeply in the year after the crisis 2008–09, and recovered only in 2009–10, across both diversified and concentrated firms. Product sophistication diverged, with diversified firms increasing through the crisis and after, in contrast to concentrated firms which continuously decreased, and were unable to recover to pre-shock levels even two years after in 2009–10 (Figure 1).
Figure 1: Average FOB, product count and product sophistication, 2006–10
Source: authors’ illustration based on customs data from Kenya Revenue Authority.
This tells us that diversified horticultural firms display robustness, as through the crisis product sophistication and average FOB improved, while concentrated firms were unable to recover even 14 months after the crisis.
Horticulture: drought and MRLs crisis, 2010–11
The number of horticulture suppliers fell by 35 per cent between 2009–11 as the sector attempted to weather the crisis. Both diversified and concentrated firms managed to recover their average FOB, with the first further increasing it to above the pre-crisis’ value (Figure 2).
Figure 2: Average FOB, product count, and product sophistication, 2009–13
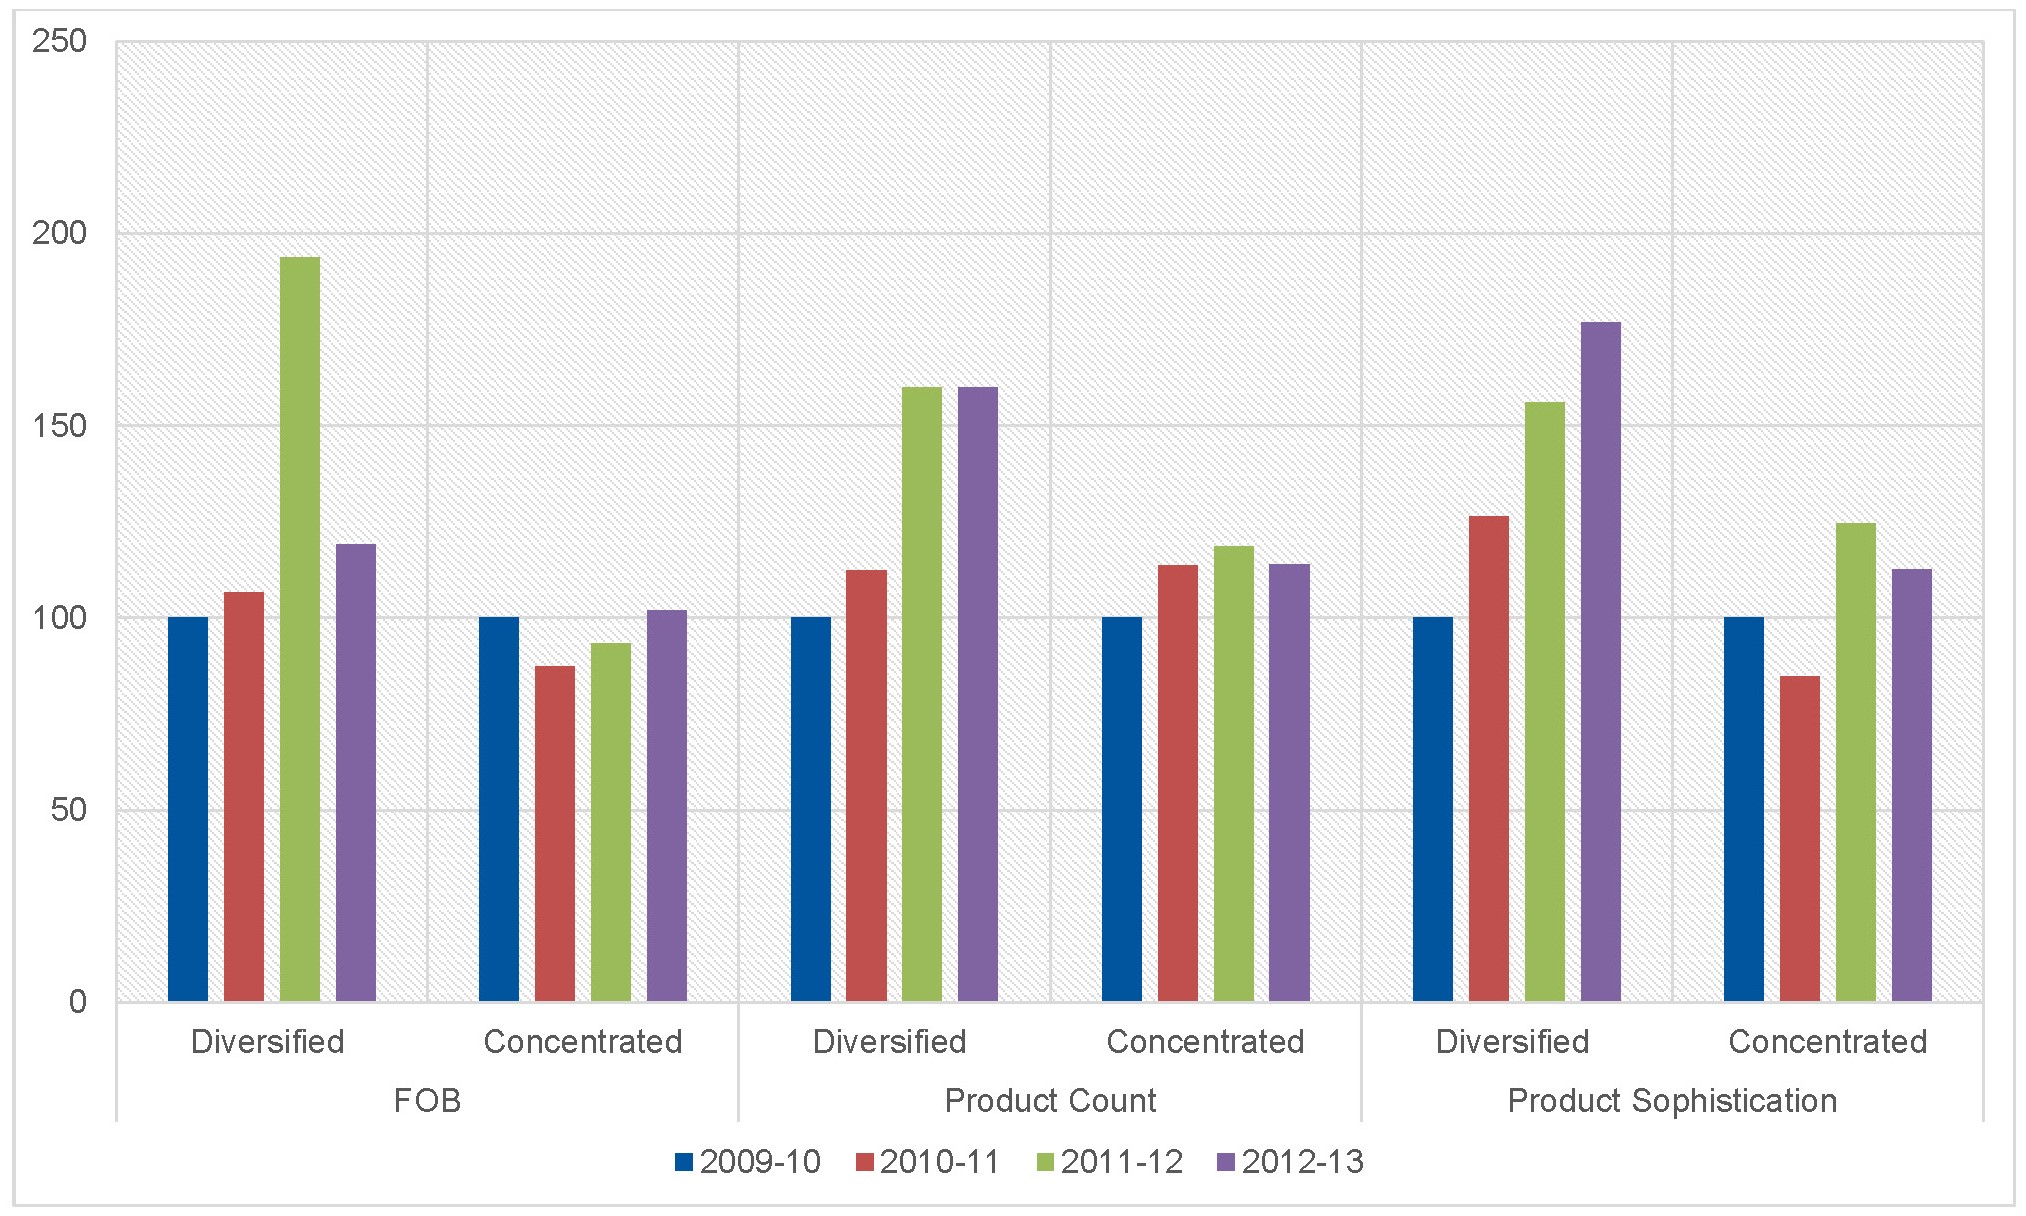
Diversified firms experienced a steady upward trend in product count and sophistication through and after the crisis. In contrast, the same indicators for concentrated firms fell during the crisis and fluctuated after. In both crises, diversified horticultural exporters showed greater robustness.
Tea: financial crisis and election, 2007–08
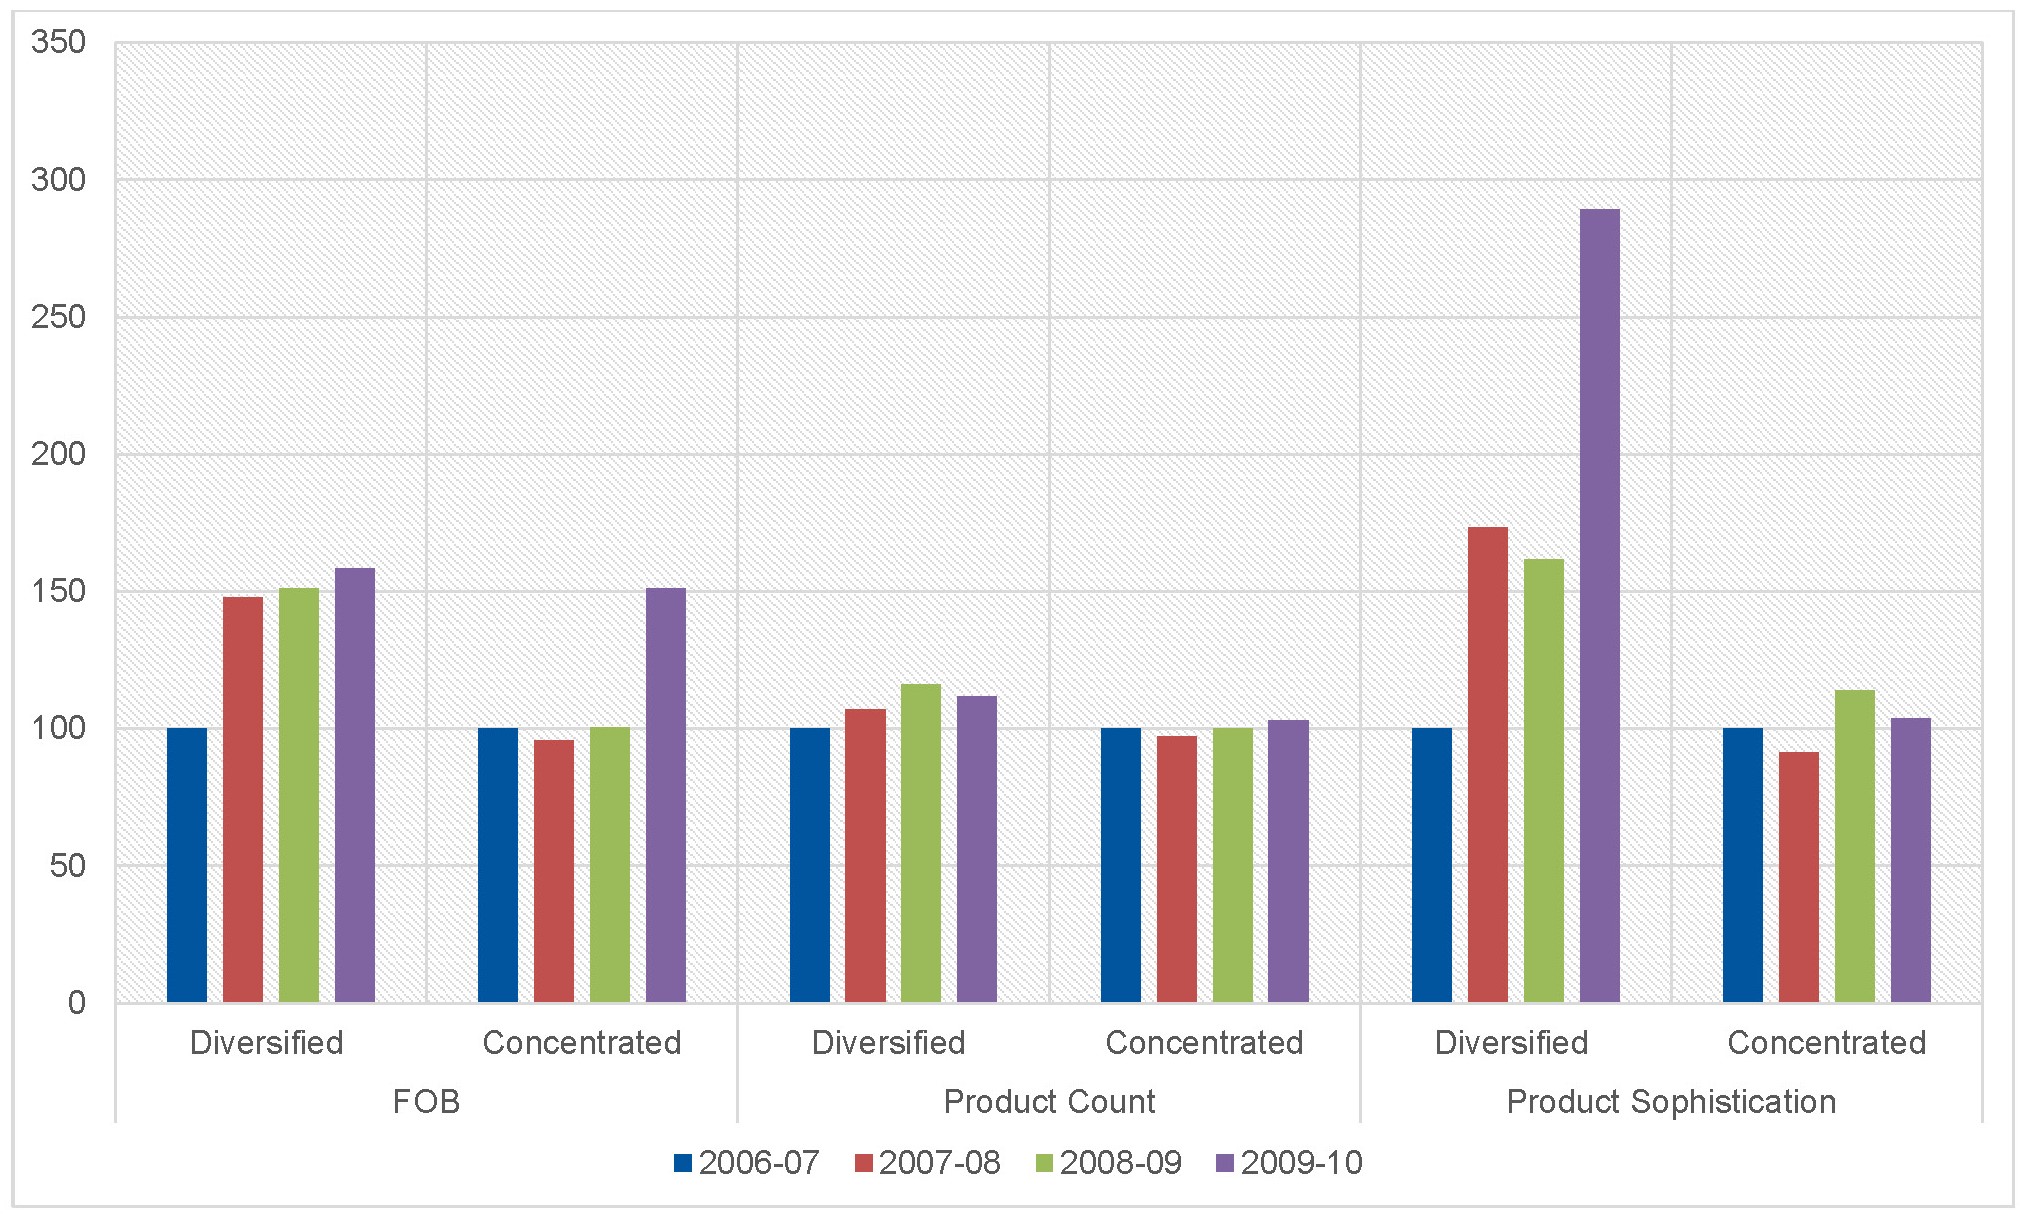
Diversified tea suppliers outperformed concentrated suppliers in terms of average FOB and continued to grow during and after the crisis. Diversified firms were also unaffected by the crisis in terms of product count and product sophistication, which continued to intensify, while concentrated firms experienced a fall on both indicators during the crisis, and then recovered marginally after (Figure 3). Clearly diversified tea exporters demonstrated robustness through the crisis.
Figure 3: Average FOB, product count, and product sophistication, 2006–10
Tea: drought and MRLs crisis, 2010–11
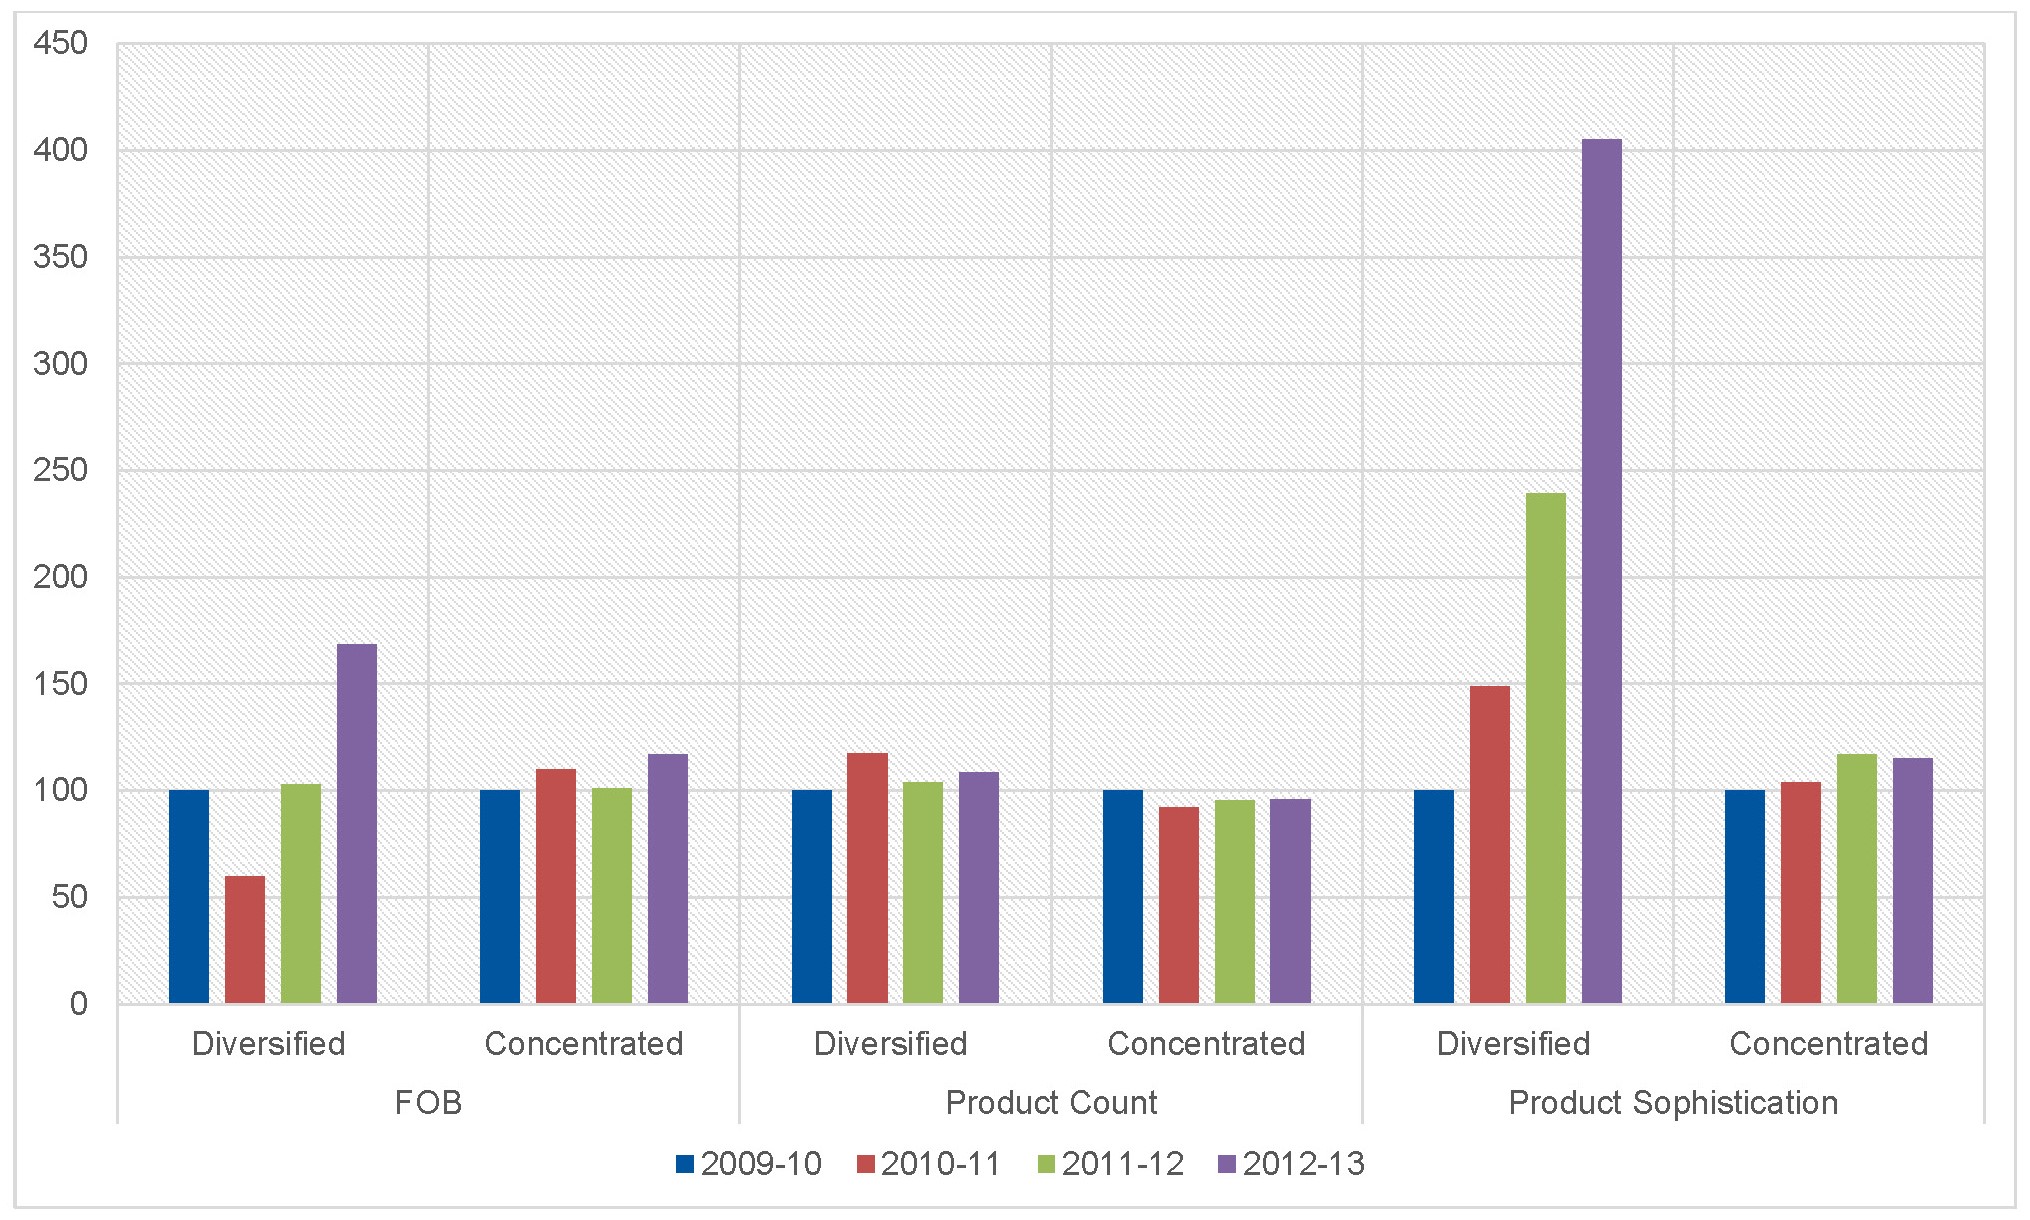
Within the tea sector, diversified firms experienced a drop in average FOB during the crisis, but swiftly rebounded by 2011–12 and overtook concentrated firms. Diversified tea exporters had higher product count and sophistication through and after the crisis. The product count fell for concentrated firms and did not rebound until after 2012–13 (Figure 4).
In the tea sector, diversified firms were more resilient as they rebounded within a year to pre-shock levels in terms of FOB, and displayed greater robustness in product sophistication and product count compared to concentrated firms Here, too, end-market diversification outperformed end-market concentration through both shocks.
Figure 4: Average FOB, product count, and product sophistication, 2009–13
Leather: financial crisis and election, 2007–08
In terms of firms’ average FOB, concentrated firms’ marginally increased while diversified firms’ fell and did not recover to pre-shock levels even in 2009–10. However only diversified firms continued to add new products to their remit through the crisis, while concentrated firms chose to invest in creating more sophisticated products instead (Figure 5).
Figure 5: Average FOB, product count, and product sophistication, 2006–10
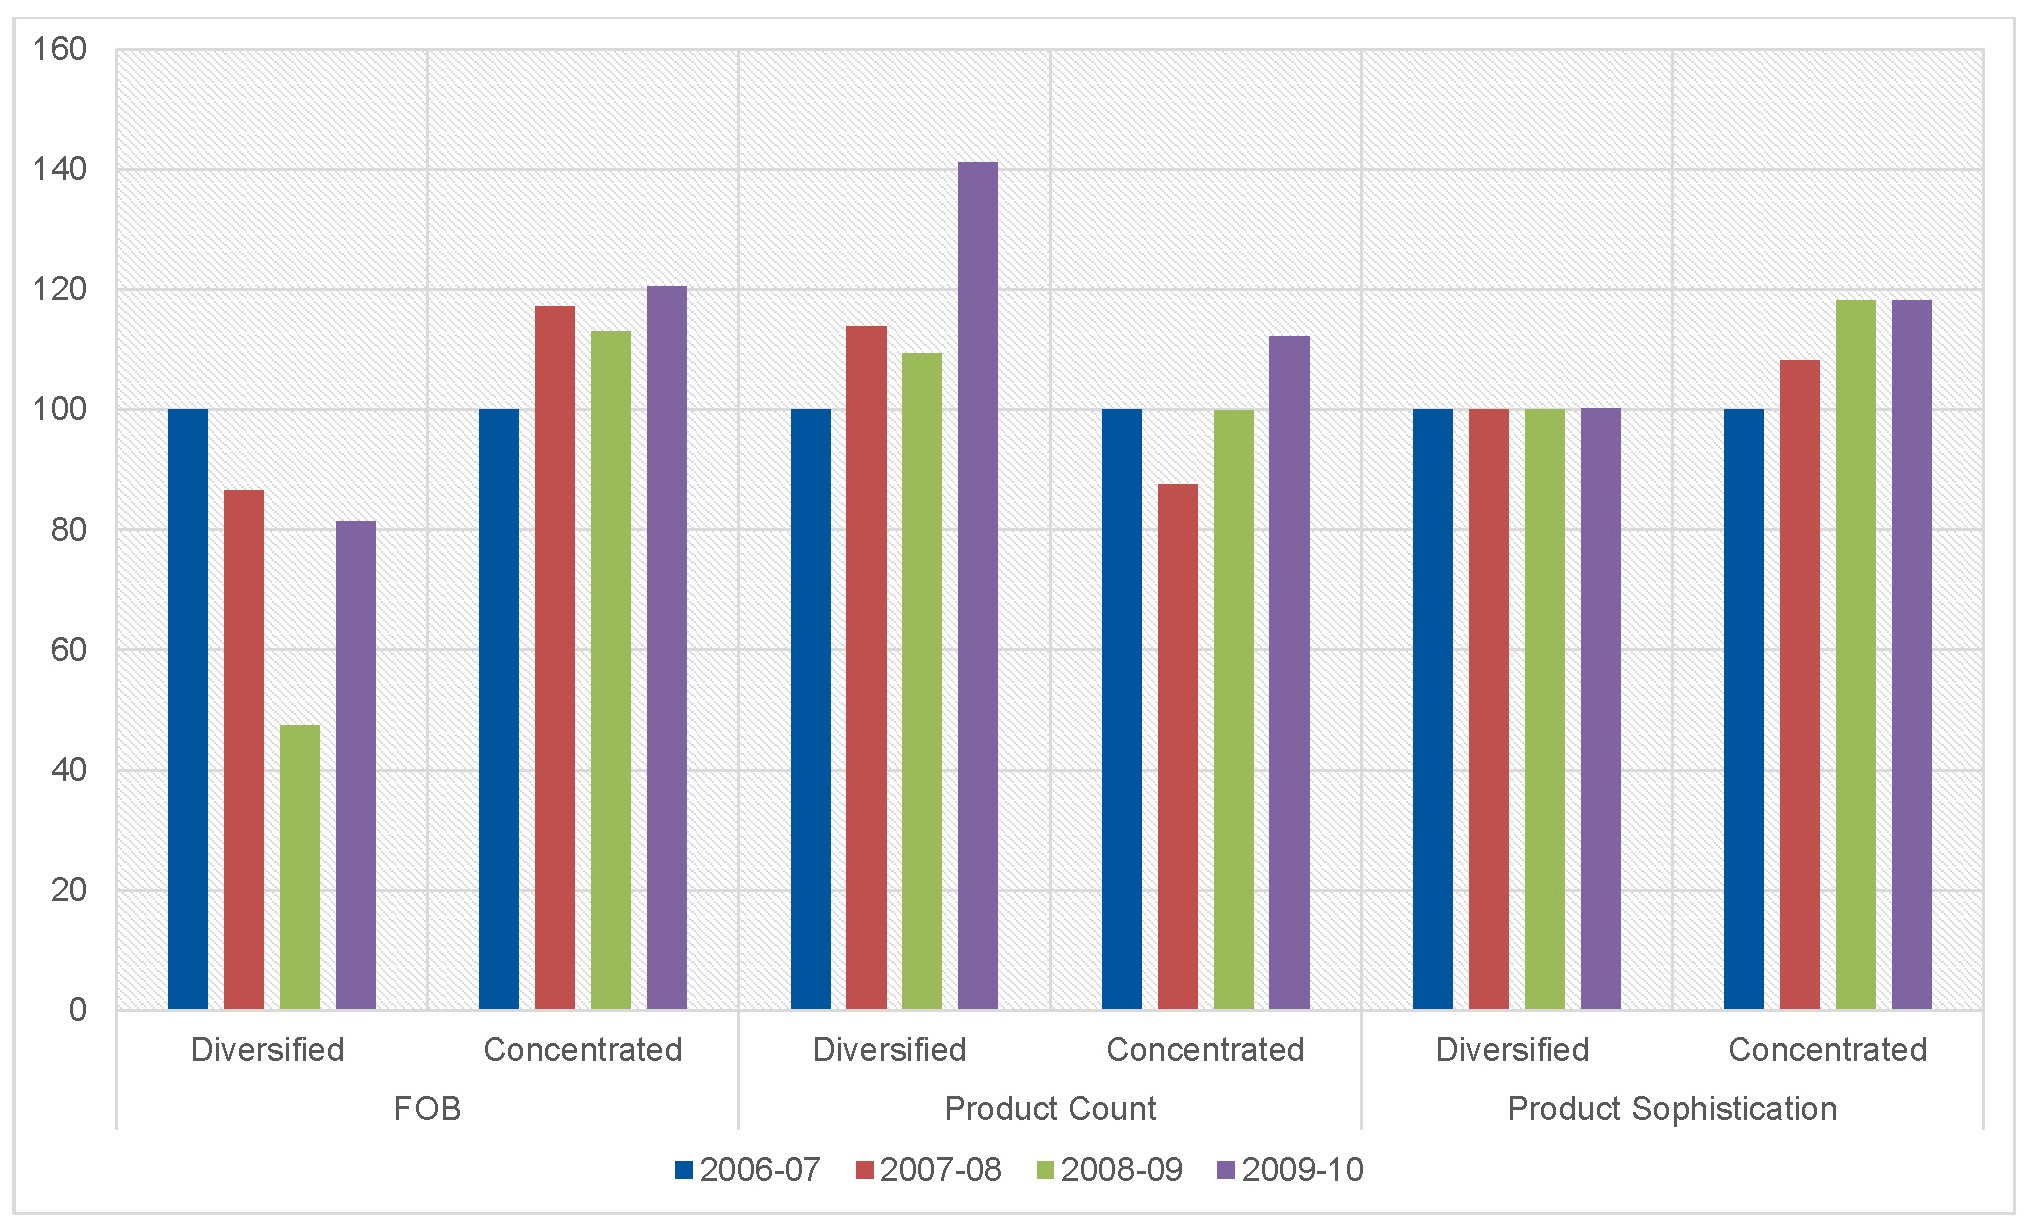
In sum, the results are mixed. While diversified firms outperformed concentrated firms in terms of product diversification, concentrated firms displayed a comparatively higher trend for FOB and product sophistication, proving to be more robust than diversified firms. Previous research on this industry shows that regional exporters within Africa concentrate on more sophisticated manufactured goods, but worldwide exporters focus on semi-processed leather, which is more likely to be influenced by economic shocks and price changes. These findings suggest that concentrated firms were more willing to climb the value-chain ladder, produce specialised goods, and demonstrate greater resilience.
Leather: drought and MRLs crisis, 2010–11
The drought significantly affected leather as it is a water-intensive sector. The average FOB stagnated, but concentrated firms outperformed diversified firms by 2011–12. On average, product count increased slightly more for diversified than concentrated firms, but this did not translate to greater revenue (FOB). Both diversified and concentrated firms experienced a marginal drop in product sophistication, but concentrated firms recovered by 2012–13. Unlike in horticulture and tea, concentrated firms in the leather sector bounced back faster and were more resilient and robust than diversified firms in both crises (Figure 6).
Figure 6: Average FOB, product count, and product sophistication, 2009–13
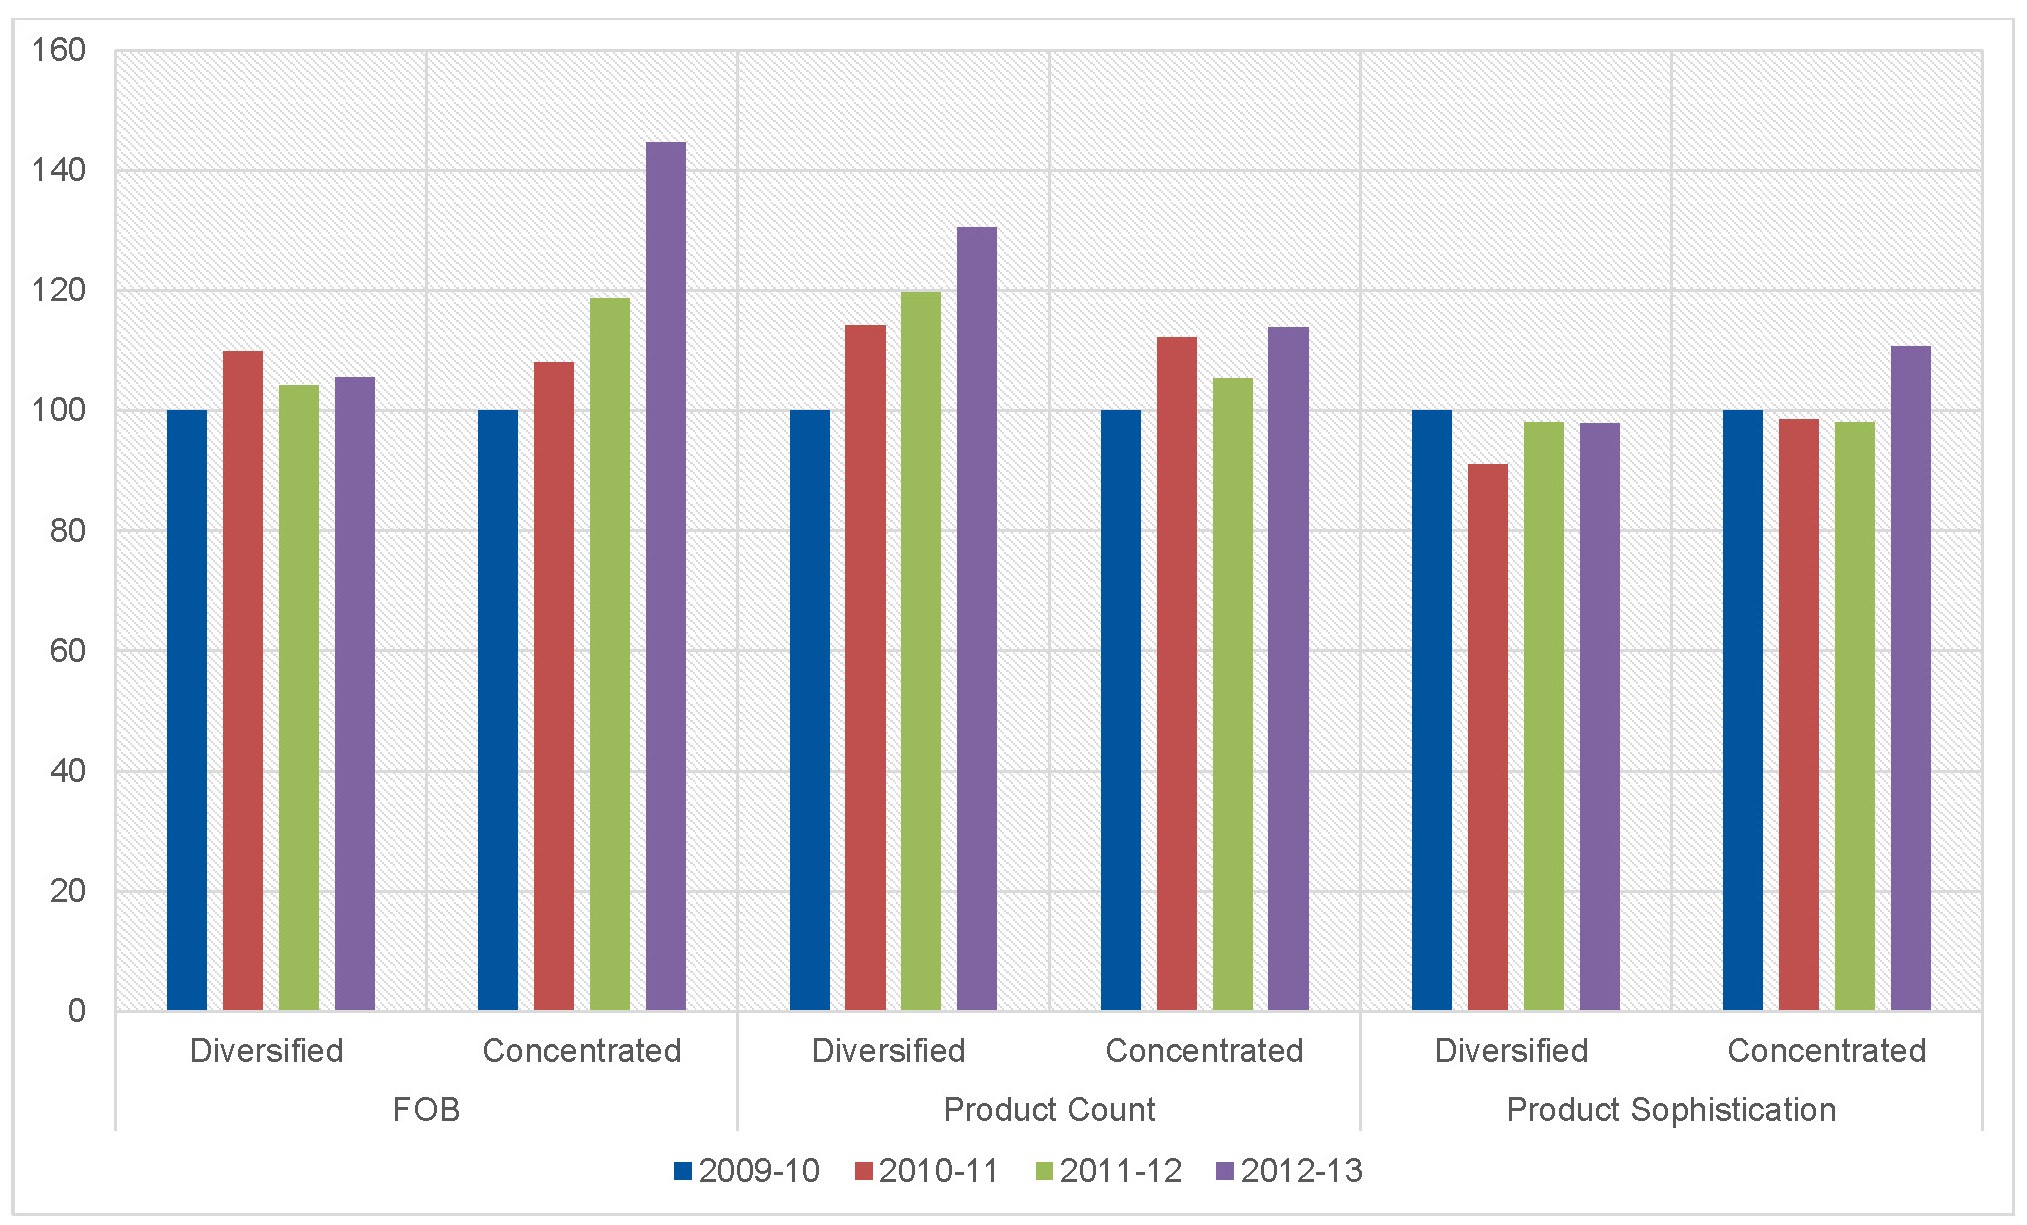
Overall, through both crises, diversified Kenyan firms in horticulture and tea remained robust and, at times, even improved their performance vis-à-vis the pre-crisis period. Finally, in the leather sector, evidence suggests that concentrated firms withstood the shocks better than diversified firms, featuring a mixture of resilience and robustness outcomes.
How can governments then effectively support firm recovery from COVID-19?
Despite both shocks being very different from each other in origin, Kenyan export firms showed similar patterns of robustness and resilience. The results indicate that through both demand-side and supply-side shocks, operating in diversified end markets was comparatively better for tea and horticulture exporters. Conversely, for the leather sector, our research shows that concentrated firms rebounded faster, in part through improved product sophistication, indicating that high-value exports for niche markets is an exploitable feature of the industry.
As we argue, these results present important lessons for both researchers and policy-makers. From a policy perspective, the Kenyan government has so far focused predominantly on reactive strategies, through both the financial and MRL/drought crises, primarily attempting to keep business going by filling immediate gaps. For instance during the financial crisis they attempted to provide cheap credit to large firms to continue export, and began developing a new standard for food safety called KenyaGAP post the MRL crisis as a means to ensure quality of produce. However, these policies are reactive and neglect to target the export strategies of firms.
In the same vein, during the COVID-19 crisis, in the horticulture sector the government implemented targeted protocols wherein farmers and suppliers need to adhere to horticulture standard KS 1758 to ensure quality and safety of produce and implement logistics hygiene standards during transport of exported produce. Again, these policies tend to try keep businesses going as usual, rather than systematically build back better.
The government should support firms with the largest potential for growth. Based on our findings, decision-makers should therefore consider sector-specific market expansion and specialization policies to support firms in the wake of COVID-19. In Kenya, it is critical to support market diversification in the horticulture and tea sector. This would also provide an opportunity for the government to monitor firm performance and offer incentives that engender those strategies which strengthen their ability to weather and rebound from shocks and upgrade their exports.
In the manufacturing sector, including leather, the Kenyan government has facilitated diversification, promoting expedited licensing, one-stop shops for trade information on new markets, export processing zones, tax rebates, better business engagement, and marketing facilities. Drawing on our analysis of the leather sector, strategies that concentrate on selling to specific countries where competitive advantage can be leveraged are the key to the robust growth of firms. It is therefore important to focus on building deeper linkages with specific end markets, while simultaneously disincentivising ties with markets where firms have been unable to grow and upgrade adequately. For instance, recent research using customs data on Kenya leather observes the critical role of China and the Eastern Africa markets as major drivers of upgrading for large and small firms respectively. In addition, the leather value chain is significantly ‘longer’ than horticulture, entailing multiple processing stages. More research is therefore warranted to understand what nodes in the chain display more resilience and robustness during crises and how shocks impact on backward and forward linkages. This would further enable the development of firm-specific measures to promote an industry that is crucial to fostering structural change in the economy.
 Join the network