Blog
35 years of research for change
Bringing inequality to the fore (1998-2020)
UNU-WIDER released the world’s first estimates of the global wealth distribution in 2007 – one result of a 2004–05 project, ‘Personal Assets from a Global Perspective’. The project’s work inspired Credit Suisse’s Global Wealth Report, which remains the most important report on wealth inequality in the world today. Nearly a decade earlier, in 1998, UNU-WIDER began a project under the helm of Giovanni Andrea Cornea that drew attention to rising economic inequality as a pressing global concern on par with global poverty. A collaboration with this project brought the World Income Inequality Database (WIID) to UNU-WIDER in 2000. The WIID has been the most comprehensive collection of income inequality statistics ever since.
The language of inequality
Last week, I did an easy experiment. I asked Google to find results for ‘top 1%’ from the years 2000–01 exclusively. Then, I searched for results from the years 2010–11.
In the first search, Google returned articles on the top lawyers, top professionals, top realtors, most gifted children, and a list of top songs featured on the Billboard 100. One result, tucked away on the second page, was a study exploring wealth inequality in the United States.
In the second search, there were suddenly pages upon pages of results discussing, almost exclusively, income or wealth inequality — with results still on page 5, and page 10, and page 15. The very first result was a Vanity Fair article by Joseph Stiglitz — with a title that uses ‘the 1%’ no less than three times in a provocative rehashing of Abraham Lincoln’s famous line from the Gettysburg Address – ‘Of the 1%, by the 1%, for the 1%’.
What this experiment demonstrates is that inequality at the turn of the century, if it was being studied at all, was not talked about in terms of the top 1%. But after the first decade of the new millennium, a part of the language of income and wealth distributions had been added to the popular lexicon, reflecting a world suddenly aware of extreme inequality as a major concern for society. Although credit for this sudden awareness deserves to be widely spread, it could never have been achieved without the efforts of the many researchers who quantified the disparity and gave us the language to understand it.
The first global wealth distribution
When UNU-WIDER released a study of global household wealth in 2007, it was the first effort to comprehensively document how wealth is distributed globally. The reception of this paper was far beyond what the researchers themselves had anticipated (140,000 downloads in the first weeks), demonstrating a real public appetite for inequality research.
Contrary to what might be expected, the first estimate of the worldwide wealth distribution wasn’t politically driven. It started out as an almost purely wonky exercise, undertaken by statistical nerds, just to prove that it was possible to construct such a distribution.
As former UNU-WIDER Director and long-time member of the Econometrics Society, Anthony Shorrocks explained in a 2014 interview, studying wealth inequality at a global level 'wasn’t really regarded at that time as something that was viable, but … we came to the conclusion that there was enough countries, enough background information, that it was worth a stab'.
The team at UNU-WIDER — which included Anthony Shorrocks, Jim Davies, Susanna Sandström, and Edward N. Wolff — would end up innovating complex methods, that few understand completely, to engineer the synthetic data needed to complement a smörgåsbord of global sources for this exercise. These synthetic data were the missing pieces to the big puzzle.
When the puzzle was completed, the WIDER Working Paper generated so much interest that it was featured in over 500 media outlets and was being downloaded so frequently that the traffic it caused crashed the UNU-WIDER website twice in one day. The original ![]() press release headlined with 'the richest 2% of adults own more than half of global household wealth’.
press release headlined with 'the richest 2% of adults own more than half of global household wealth’.
Today, statements along these lines are nothing but familiar. For example, a statement such as 'The top 1% own more than the bottom 40% combined' is a common paraphrasing of a direct finding (for the year 2000) from the UNU-WIDER team.
‘The 1%’
Today, this stunning summary of inequality in the world is so well popularized that we often talk about the richest members of the population as simply ‘the 1%’ without bothering to add a qualifier. The Occupy movement, launched on Wall Street two years after the paper, is often considered a major part of why. That social movement captured the political moment so well that it became part of the reason that Time Magazine named ‘The Protester’ their 2011 person of the year. The Occupy slogan 'We are the 99%' probably did more to popularize the 1% as a political concept than anything else. But Occupy was never alone in bringing this vocabulary into the modern lexicon.
Although ‘the 1%’ as a phrase and identifier is not new to this century, published examples before 2000 are surprisingly difficult to find. But by 2011, Barack Obama was calling inequality ‘the defining challenge of our time’ and Pope Francis had issued an official apostolic exhortation that compared inequality to one of the great sins and suggested there should be an eleventh commandment against it.
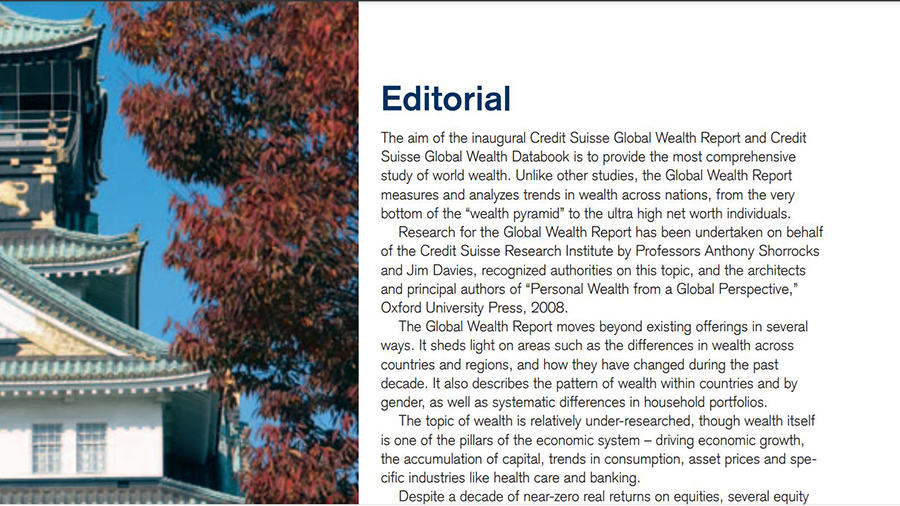
When the Credit-Suisse Group launched their first Global Wealth Report into this environment in 2010, it was an extension of work that had begun at UNU-WIDER. The editorial foreward to the report cites the UNU-WIDER team’s book as the authoritative account. It reads, ‘Research for the Global Wealth Report has been undertaken on behalf of the Credit Suisse Research Institute by Professors Anthony Shorrocks and Jim Davies, recognized authorities on this topic, and the architects and principal authors of "Personal Wealth from a Global Perspective," Oxford University Press, 2008.’

Inequality on center stage
In a way, inequality has more of a center stage now than it ever has before. This was one of the goals of the 1998–99 UNU-WIDER project that resulted in the WIID establishing residence at the institute in 2000. Until very recently, when research began to proliferate, we did not know that much about inequality at a global level.
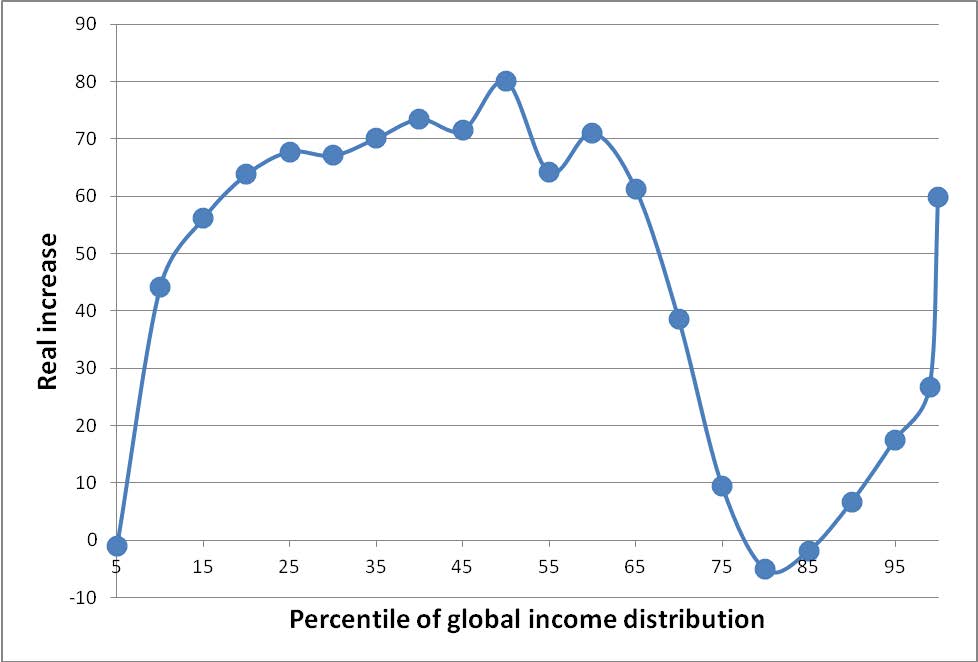
Now, the recent evolution of global income and wealth inequality are pointed to as explanations for major global trends. A famous example is the 'elephant curve' produced by Branko Milanović.
Figure: 'The elephant curve': Change in real income between 1988 and 2008 at various percentiles of global income distribution (calculated in 2005 international dollars)

The elephant curve shows how new income was distributed globally between 1988–2008. It makes it glaringly obvious that those in the 80-98th percentile of the global distribution — mostly the middle class in high-income countries — did not gain from this era of globalization. That fact has been used to explain a variety of major events, such as the rise of populism in the Global North and Brexit.
This example illustrates how, now, we think inequality matters.
As Jim Davies noted, ‘Part of the reason there has been this increasing interest [in inequality] is because of what the researchers are doing’. UNU-WIDER has been, and continues to be, a pioneer in inequality fact-finding and a home for research and discussion on how to reduce global inequalities.
The views expressed in this piece are those of the author(s), and do not necessarily reflect the views of the Institute or the United Nations University, nor the programme/project donors.
 Join the network


