 Join the network
Background Note
The cost of waiting
A total of 3.3 billion people live in countries that spend more on interest payments than on either education or health.
UNCTAD, A World of Debt
Introduction
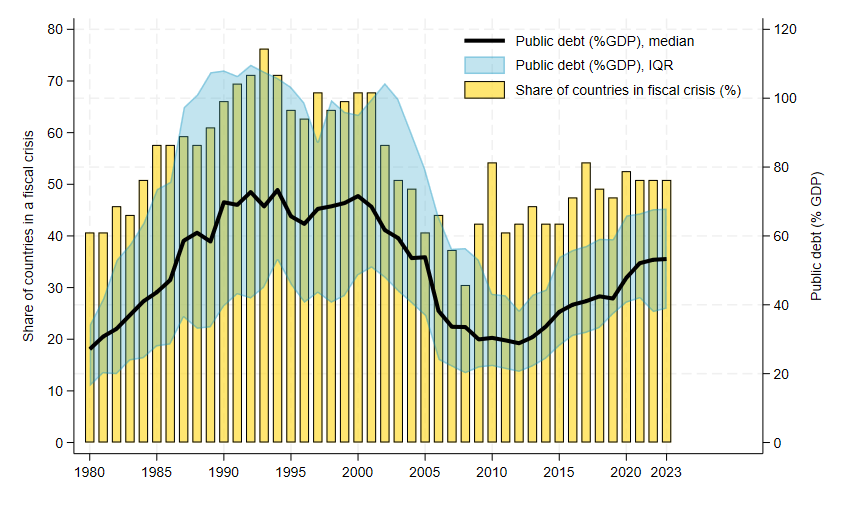
Following a decade of rapid debt accumulation, exacerbated by the COVID-19 pandemic, public debt ratios in developing countries have stabilized, albeit at high levels. This has renewed concerns about fiscal crises, which are characterized by periods of heightened budgetary stress1 and tend to be closely associated with high public debt and debt service ratios. The share of low-income countries (LICs) undergoing a fiscal crisis has been increasing in recent years, reaching over 50 percent by 2023. Relatedly, public debt for the median LIC stood at 53% of GDP, mirroring the level recorded in 2005 (Figure 1, panel A), the year several LICs received debt relief under the Multilateral Debt Relief Initiative (MDRI).
The incidence of fiscal crises among emerging market economies (EMEs) was about half of that in LICs, with average debt levels exceeding 60% of GDP—surpassing the peaks observed during the 1980s debt crisis. Adding to these challenges, many emerging and low-income countries are confronting high costs of financing, large external refinancing needs, and a decline in net external flows amid important investment and social spending needs.
Figure 1: Public debt and fiscal crises
(a) Low-income countries
(b) Emerging market economies
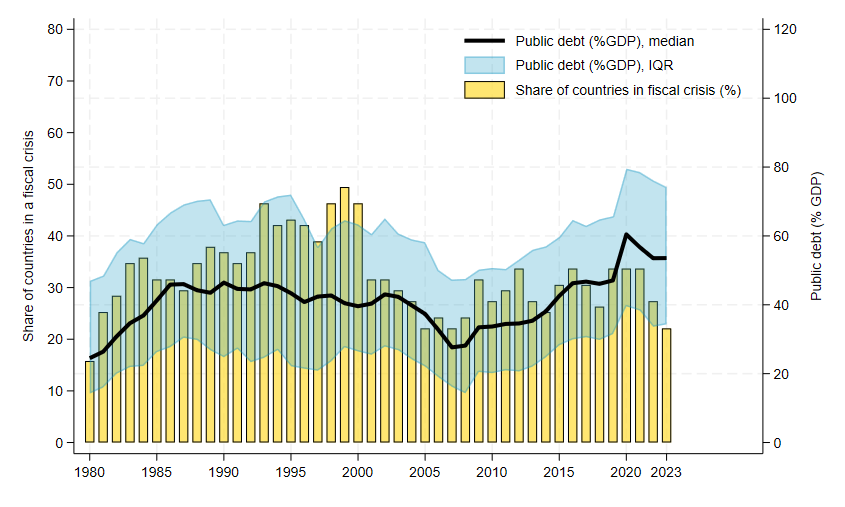
Source: Global Debt Database, IDS, WEO, Gamboa-Arbelaez et al. ('Global Waves or Local Ripples?', forthcoming), and authors’ calculations.
These developments are not unprecedented. Over the past five decades, emerging and developing countries have experienced multiple waves of debt accumulation, characterized by prolonged fiscal distress and slower growth. To avoid repeating past mistakes, the international community responded promptly to the pandemic by providing a debt repayment moratorium, which helped ease liquidity pressures for eligible debtor countries. This was followed by a G20-led debt restructuring initiative (the ‘Common Framework’) and then by the Global Sovereign Debt Roundtable (GSDR), a broader platform for dialogue and cooperation on sovereign debt issues.
Nevertheless, progress was initially slow—partly because of the complexity of negotiations among diverse creditor groups with conflicting interests and the reluctance of debtor countries to buy into the restructuring proposals—and fiscal vulnerabilities continued to rise. Without proactive policy action—including revenue mobilization—and further improvements to increase the effectiveness of debt resolution mechanisms, there is a risk of protracted fiscal crises in the years ahead.
A key implication of this challenging fiscal outlook is the potential reduction in social spending, as a rising debt service absorbs an even-larger share of government revenues, straining public budgets. This trend is especially troubling for LICs given the significant hurdles these countries must overcome to achieve the Sustainable Development Goals (SDGs). Recent estimates by Carapella et al. suggest that by 2030, LICs will need additional resources amounting to 16.1% of GDP to meet the SDG targets, with sub-Saharan Africa being the region with the highest needs (19.4% of GDP). By contrast, emerging market economies (EMEs) face additional spending amounting to 4.8% of GDP, while the additional cost for advanced economies (AEs) is less than 0.2%.
Therefore, it is important to understand the implications of fiscal crises—particularly protracted episodes, as they are more likely to erode a governments’ capacity to spend and invest. While there is evidence about the macroeconomic effects of fiscal crises that end up in sovereign defaults (see Borensztein and Panizza; Kuvshinov and Zimmermann; Marchesi and Masi; and Asonuma et al.), their social costs have been overlooked by the literature with the notable exception of Farah-Yacoub et al. Drawing on Gamboa-Arbelaez, Moreno Badia, and Presbitero (forthcoming),2 this note goes beyond the analysis of rare events like sovereign defaults and studies the social costs of a wide range of fiscal crisis episodes across a large sample of emerging and developing economies since 1980. Overall, we find that, by reducing the space available to finance education and health, fiscal crises can have large social costs. These costs are not exclusive to credit events, but also apply to other types of crises. This result is driven by what we characterize as protracted episodes and highlights the need to resolve crises early on.
Fiscal crises and social expenditures
Definitions
To define fiscal crises, we follow Medas et al. and use the data updated in Gamboa-Arbelaez et al. (forthcoming).3 Fiscal crises are a broader concept than sovereign defaults and include episodes of large fiscal imbalances that lead to the adoption of extreme measures such as default and monetization of the deficit—when the government borrows from the central bank to finance the budget deficit. In practice, Medas et al. identify fiscal crises as periods when any of the following four criteria are met: (1) credit events linked to sovereign debt, such as defaults or restructurings; (2) reliance on large-scale IMF financial assistance; (3) implicit domestic public default, often through high inflation; and (4) a loss of market confidence in the sovereign as captured by bond issuances coming to a halt; or very large borrowing costs or sovereign yield spikes. In our sample, over half (58%) of the fiscal crises involve a credit event, and 16% of fiscal crises are characterized by more than one event during the episode.
Data on social spending in developing countries are limited and often fragmented. Our starting point is the International Food Policy Research Institute’s SPEED database, which consolidates information from sources such as the IMF’s Government Financial Statistics, the World Bank’s Public Expenditure Reviews, and various regional and national data repositories. To address gaps for recent years, we supplement these data with figures from the World Bank’s World Development Indicators, creating a comprehensive dataset on social spending from 1980 to 2021. Our analysis focus on health and education expenditures, both measured in real per capita terms (2010 PPP dollars).4 Data on health and education expenditures include only public spending and cover current expenditures on services provided to individuals (for health) and pupils (for education), as well as spending on a collective basis, but they do not include capital expenditures—e.g. data include teacher salaries but not investment in new school buildings.
Stylized facts
Stylized fact 1. Fiscal crises are common, widespread, and tend to come in waves. Since 1980, there have been nearly 500 crisis episodes in emerging and developing countries, with over three-quarters of these countries experiencing at least one such event. Over 60% of these episodes were triggered by credit events. On average, close to 40% of countries were in a crisis in any given year but incidence has changed over time. In the 1990s, this share was nearly 50%, was reduced by half following the MDRI, began to rise again around the global financial crisis, and has since stabilized at approximately one third. The occurrence of fiscal crises is significantly higher among LICs, with approximately half experiencing a crisis at any given time, highlighting the more challenging macroeconomic and fiscal environment these countries face. The highest crisis incidence occurred in the early 1990s—when over 70% of LICs were affected—while the lowest incidence—around one quarter—was observed following the implementation of the MDRI (Figure 1, panel A).
Stylized fact 2. Fiscal crises tend to persist for extended periods. On average, the duration of a crisis episode is 5.7 years but there are substantial differences across income groups. Fiscal crises in LICs typically last an average of 6.4 years, compared to 5.3 years in EMEs and 3.4 years in AEs.5 This suggests that fiscal crises are often protracted episodes that may not be resolved in one-go, consistent with the idea of serial defaults resulting from interim restructurings that fall short of placing debt on a sustainable path (Reinhart et al. and Graf von Luckner et al.).6 However, fiscal crises tend to be path-dependent: the longer you’re stuck in it, the tougher it is to exit (Gamboa-Arbelaez et al., forthcoming).7 This implies that without external interventions, such as improvements in economic conditions or policy changes, countries can remain in prolonged fiscal distress going forward. Henceforth, we define long crises as those lasting at least six years (above the sample average) and short crises all the others.
Stylized fact 3. There are significant disparities in per capita health and education public spending across country income groups. Over our sample period, AEs allocate, on average, about USD 1,500 constant 2010 PPP to education and USD 1,700 to health per capita. In comparison, EMEs spend USD 500 on education and USD 350 on health while LICs invest only USD 115 on education and USD 50 on health.8 These stark differences underscore the challenges faced by LICs in meeting basic social needs and closing the development gap with higher income countries, even in the absence of a crisis event.
Stylized fact 4. Fiscal crises are associated with lower social spending. When looking at the share of countries experiencing fiscal crises over time alongside average per capita public expenditures on health and education, one can observe a clear negative correlation—particularly in LICs—underscoring the broader social costs of fiscal instability. But not all fiscal crises are created equal and clear-cut differences emerge when comparing long fiscal crises to short ones. Notably, the increase in the relative incidence of longer crises in recent years—especially in LICs—has been associated with a decline in the levels of education and health per capita spending.
The costs of fiscal crises: empirical estimates
Analyzing the consequences of fiscal crises poses significant challenges, as these events are not randomly distributed. Countries in fiscal distress often face weak macroeconomic conditions that can contribute to the economic and social costs we observe, making it difficult to disentangle the effects of the crises themselves. This complicates establishing a clear causal link between fiscal crises and economic/social outcomes because simple before-and-after comparisons of macroeconomic conditions fail to provide meaningful insights. Similarly, applying a standard difference-in-differences approach would not yield robust estimates because it assumes that crises happen independently of economic conditions.
In practice, however, countries that enter a fiscal crisis are likely to have different economic conditions than those not in a crisis. And these macro conditions—such as current account imbalances—could affect social outcomes. To separate the effect of the crisis from that of macroeconomic condition, our empirical approach attributes different weights to each observation to ensure that the treated countries (those that had a crisis) are similar to the control ones (those that did not have a crisis).9 This in turn, allows for a more robust analysis of the effects of crises on social spending and other key outcome variables.
The results discussed in this section are based on a sample of 78 emerging markets and developing economies. Additional findings and a wide range of robustness tests are discussed in Gamboa-Arbelaez, Moreno Badia, and Presbitero (forthcoming).10
The economic impact of fiscal crises
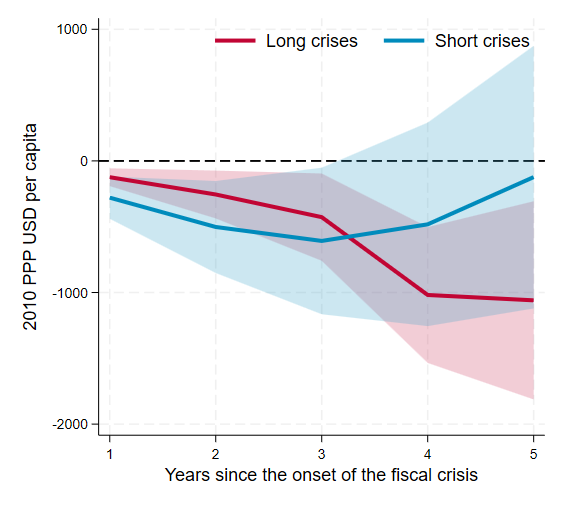
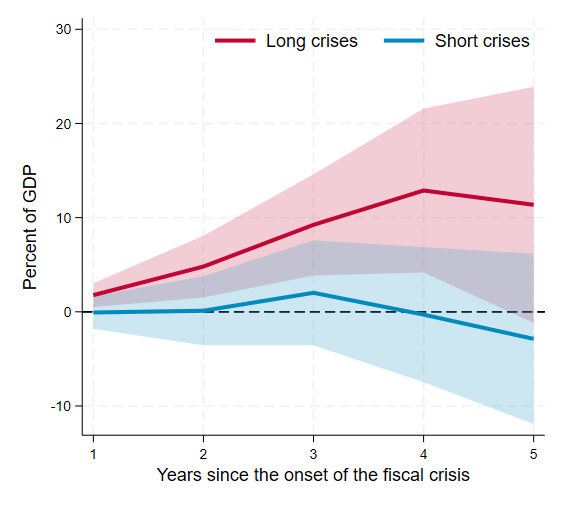
Before assessing the social costs of crises, we examine a few key macroeconomic variables to identify potential transmission channels. Comparing the GDP dynamics by crisis duration, we find that short crises are associated with a modest and temporary drop in GDP per capita, which quickly recovers and turns into positive territory within a decade. By contrast, long crises are associated with a larger and more persistent GDP decline (Figure 2, panel A). Crucially, only protracted crises are associated with a significant rise in public debt and debt service ratios (Figure 2, panels B and C), while revenues (as a share of GDP) remain stagnant (Figure 2, panel D). Taken together, this evidence suggests that a higher debt service, without a corresponding increase in revenue, may crowd out social spending after a protracted fiscal crisis.
The social impact of fiscal crises
Having established the mechanism through which protracted fiscal crises can weaken public spending capacity, we turn to their impact on health and education spending. Using again the pooled sample of LICs and EMEs, which includes all fiscal crisis episodes, we find evidence that fiscal crises are associated with a reduction in per capita social public spending. Specifically, five years after the onset of a fiscal crisis, countries experience an average reduction of about USD150 per capita in education spending and USD80 per capita in health expenditure.
These average effects are largely associated with long fiscal crises whereas short crises show no statistically significant effects on social spending. Figure 3 (Panel A) illustrates the results for education spending, showing that, during long fiscal crises, countries reduce their education expenditure by approximately USD160 per capita after five years, while short crises are not linked to any significant change. A similar pattern emerges for health expenditures (Figure 3, panel B), with long fiscal crises associated with an average reduction of more than USD90 per capita in health spending after five years, while short crises show no meaningful difference. These numbers imply that, five years after the onset of the crisis, the cumulative per capita education (health) expenditures would have declined by 10.6% (8.6%) compared to a scenario without a fiscal crisis.
Figure 2: Economic Impact of fiscal crises
(a) GDP per capita
(b) Public debt (% GDP)
(c) Interest payments (%GDP) 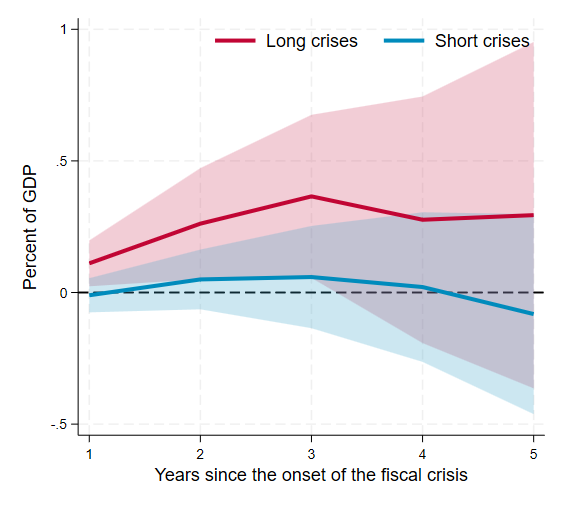
(d) Revenues (% GDP)
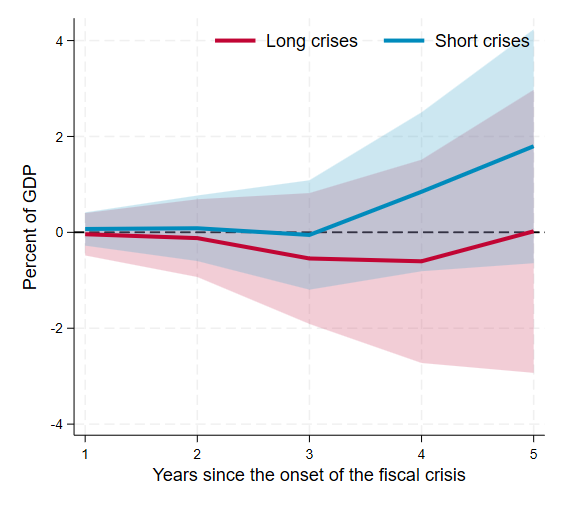
Figure 3: Health and education expenditure impact of fiscal crises
(a) Education expenditure (per capita)
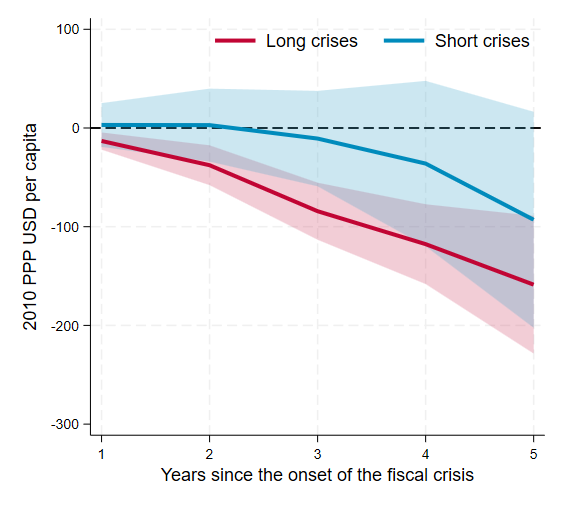
(b) Health expenditure (per capita)

The cost of waiting
Our empirical findings indicate that protracted fiscal crises can have lasting effects on social spending. To assess the real-world impact, we simulate projected SDG financing needs, incorporating the estimated cumulative effects of these crises. Our starting point are the SDG costs from Carapella et al. Leveraging our model’s coefficients, we then quantify the additional financing gap that would arise if ongoing fiscal crises become protracted and its implications for human development indicators. The sample consists of 20 countries that were experiencing a fiscal crisis as of 2023. Most of these countries are in Africa, with an average GDP per capita of USD 3,763.
Our back-of-the-envelope calculations, based on the estimated declines in per capita social spending and the projected costs to achieve the SDGs in health and education, suggest that protracted fiscal crises could leave an additional 44.9 million children out of primary education and 60.2 million people without access to health coverage.11 To conduct our calculations, we make several simplifying assumptions. First, the SDG data relies on primary school enrollment, whereas our measure considers total education expenditure per student across all levels. Similarly, for health, we use total health expenditure, while the SDG financing gap is based solely on public health expenditures. Finally, we do not have granular data to distinguish between public and private service provision. Although these simplifying assumptions do not allow a perfect apples-to-apples comparison, our estimates effectively illustrate the substantial impact of fiscal crises on the potential to achieve the SDGs.
The findings in this note highlight the profound and lasting social and economic impacts of fiscal crises in developing countries. However, not all crises have the same effects. Short fiscal crises are associated with limited and temporary effects on social spending and economic performance. In contrast, prolonged crises coincide with persistent declines in GDP per capita and significant reductions in education and health expenditures, with these costs starting to accrue upfront. Our results further suggest that prolonged crises contribute to rising public debt ratios and debt service costs, further constraining fiscal space and limiting essential social investments in already resource-strapped economies. This heterogeneity underscores the importance of early intervention and resolution to mitigate the adverse effects of fiscal distress on critical social outcomes.
This analysis adds to the broader literature by providing evidence on the distinct impacts of fiscal crises based on their duration, complementing existing research on the cost of sovereign defaults. The observed relationship between fiscal distress, declining social spending, and economic downturn underscores the urgency of addressing fiscal vulnerabilities before they are turned into a protracted crisis. To safeguard progress toward achieving the SDGs, policymakers should focus on restoring fiscal sustainability and preserving essential social expenditures, particularly during periods of economic strain.
Endnotes
1 While sovereign defaults are an important part, they do not capture all periods of fiscal crises—more than 40 percent of crisis episodes since the 1980s are unrelated to credit events.
2 Gamboa-Arbelaez, J., Moreno Badia, M., And Presbitero, A. F. (forthcoming, 2025). The Cost of Waiting. Unpublished manuscript.
3 Gamboa-Arbelaez, J., Moreno Badia, M., Imamoglu, E. And Medas, P. (forthcoming, 2025). Global Waves or Local Ripples? Exploring the Anatomy of Fiscal Crises. Unpublished manuscript.
4 Data from the World Bank is reported in nominal terms. To ensure consistency with IFPRI data, real amounts are calculated using the GDP deflator and the 2010 PPP exchange rate.
5 When assessing duration, we do not consider the crisis periods that are ongoing at the end of the sample because we cannot determine the exact end date.
6 Due to data limitations the analysis here presented does not allow us to explore the potential impact that preemptive restructurings could have for different social spending outcomes.
7 Gamboa-Arbelaez, J., Moreno Badia, M., Imamoglu, E. And Medas, P. (forthcoming, 2025). Global Waves or Local Ripples? Exploring the Anatomy of Fiscal Crises. Unpublished manuscript.
8 These statistics refer to 146 countries (34 AEs, 73 EMEs and 39 LICs). Dropping the last 2 years of the sample, affected by the COVID-19 pandemic, or focusing on a sub-set of countries (34 AEs, 60 EMEs and 24 LICs) with at least 20 years of date delivers very similar numbers.
9 Specifically, we use the Augmented Inverse Probability Weighting (AIPW) within a Local Projection framework. The AIPW estimator adjusts for selection bias by weighting observations based on the probability of experiencing a crisis. Countries that are less likely to experience a crisis receive higher weights, while those more likely to experience a crisis receive lower weights, conditional on the estimated propensity scores. By adjusting the weight of each observation so that the treated (countries that had a crisis) and control (countries that did not have a crisis) groups become more comparable, we mitigate the biases arising from the endogenous nature of fiscal crises.
10 Gamboa-Arbelaez, J., Moreno Badia, M., And Presbitero, A. F. (forthcoming, 2025). The Cost of Waiting. Unpublished manuscript.
11 Although the estimates for education expenditures are larger than those for health expenditures, we assume that reductions in health expenditures impact the entire population, whereas reductions in education expenditures primarily affect the school-age population.