 Join the network
Blog
A tale of two cities: Can electricity supply save lives without deepening divides?
On 25 May 2023, three-year-old Neyamiah James died after extended electricity outages in Johannesburg caused her home oxygen machine to run out of backup power. On 4 March 2023, Yengiwe Mthimunye died after being turned away from Waterval Clinic in Mpumalanga because of a power outage. Bhekisisa relayed an anonymized account of a load-shedding-induced death at Charlotte Maxeke Hospital in July 2022. On 25 November 2023, a man died after being refused entry to a clinic in Limpopo, reportedly because of a power outage. In January 2023, power outages allegedly contributed to five farmworkers’ deaths from heatstroke in Kakamas in the Northern Cape.
These deaths are likely only the tip of the iceberg regarding the health impacts of load shedding, a common practice in South Africa where electricity supply is intentionally reduced to prevent overloading the grid, resulting in scheduled power outages. With support from SA-TIED, I investigated the effects of load shedding on mortality rates in South Africa, focusing on Cape Town. The findings are alarming.
Uncovering the true impact of load shedding
The main challenge in determining the causal effects of load shedding is that it is not implemented randomly. Many existing studies assume it is random by drawing causal conclusions from regressions of national load-shedding incidence on various outcomes. However, load shedding has seasonal patterns (it tends to worsen in summer) and a long-run trend (it has generally worsened over time). This means load shedding might spuriously correlate with any factor that has a similar seasonal component (such as ice cream sales) or long-run trend, even if it’s unrelated to load shedding.
In my study, I investigate the causal effect of load shedding by comparing outcomes in Cape Town, which has used the Steenbras pumped-storage hydroelectric plant to mitigate load shedding in its service district since June 2015, to the rest of the country, which lacks such a policy. I combine three different episodes—one in each of 2015, 2018, and 2019—where Cape Town’s municipally supplied electricity network experienced mitigated load-shedding after at least 18 weeks of the same load shedding as the rest of the country.
Constructing a synthetic city to measure load shedding's impact
Cape Town differs from the rest of the country in many ways, not just its load-shedding policy. To address this, I used synthetic control, a method that constructs a ‘synthetic Cape Town’ as a weighted average of other parts of the country. The weights ensure that synthetic Cape Town closely resembles actual Cape Town during periods without load-shedding mitigation.
If successful, the method allows us to attribute differences in outcomes between actual Cape Town and synthetic Cape Town, when load shedding mitigation starts, to the causal effects of the policy.
How does Cape Town compare to the synthetic city?
Figure 1 shows the difference in weekly deaths per 10,000 population (age ≥ 65), comparing Cape Town to synthetic Cape Town, for the 18 weeks before and 9 weeks after load shedding mitigation starts.
Figure 1: Difference in weekly deaths per 10,000 population (age ≥ 65), Cape Town versus synthetic Cape Town
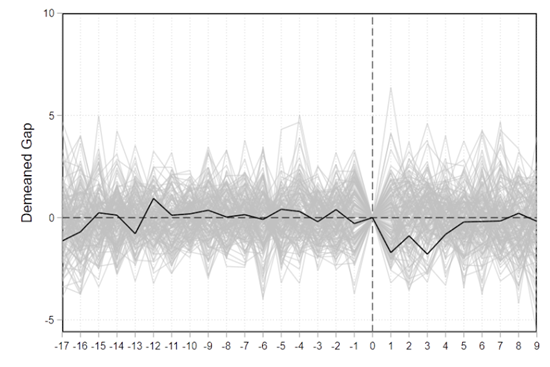
It is encouraging that no systematic gap exists between actual and synthetic Cape Town before mitigation starts. This suggests that synthetic Cape Town is a good counterfactual for actual Cape Town. Immediately after mitigation starts, there is a decrease in mortality among those aged 65+ in Cape Town relative to synthetic Cape Town, indicating that the city is preventing deaths that would normally occur due to electricity interruptions. This effect is loaded in the first few periods after mitigation starts, which is consistent with the time pattern of mitigation intensity.
The city’s strategic defense against load shedding
What do the results imply in terms of actual numbers of deaths averted?
I end up with a large, but admittedly imprecisely estimated effect. Specifically, the results suggest that Cape Town’s mitigation policy averted 547 premature deaths among the 65+ population in the city’s service district between 2015 and 2019. But because the 95% confidence interval is so wide, I can’t rule out that the real number over this period is between 94 and 1,002 for premature deaths averted.
One can extend these results to understand how many premature deaths were caused by load shedding, rather than averted by the city’s mitigation policy. The same numbers suggest that load shedding caused 2,623 (95% confidence interval 452 to 4,805) premature deaths in the city-supplied 65+ population between 2014 and 2019 during the weeks without load-shedding mitigation. These numbers are large—perhaps implausibly so at the extremes—and I think it is more likely that the true number is on the lower end of the confidence interval than the higher end.
A city of contrasts
What about estimating the number of 65+ deaths caused by load shedding across Cape Town as a whole rather than just the city’s service district? Or across the country? In theory, one could just extend the results of this analysis to these broader populations. But the problem is that the population in the city’s service district is unique, and so we probably shouldn’t assume that other populations have the same mortality response to load shedding.
Figure 2 shows the ‘City-supplied’ versus ‘Eskom-supplied’ areas in Cape Town. Looking at this map, anyone familiar with Cape Town’s geography would be unsurprised to learn that city-supplied regions are much older and richer than the rest of the city and the rest of the country.
Figure 2: City of Cape Town (CoCT) versus Eskom electricity supply regions in Cape Town (Source: ‘Project 90 by 2030’, 2021)
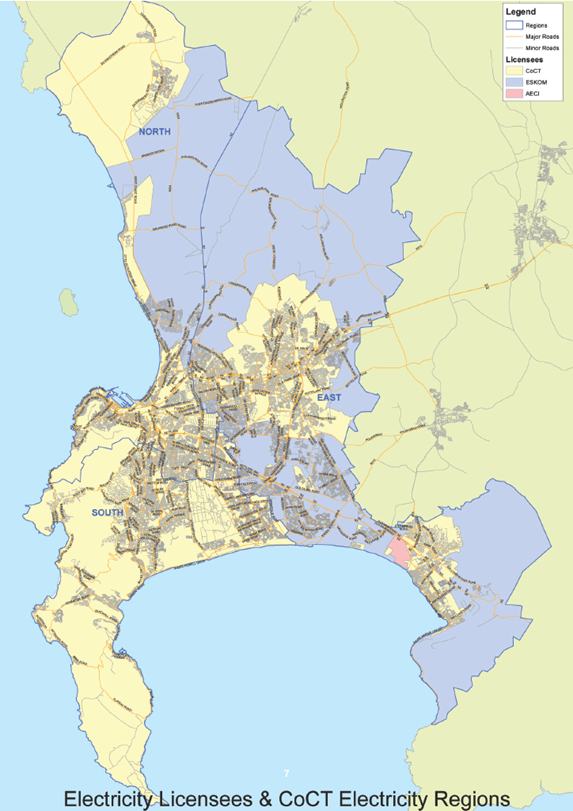
Note: This map outlines the electricity distribution regions within the city of Cape Town categorized into North, East, and South regions. The colors indicate the responsible electricity providers: yellow for CoCT, blue for ESKOM, and pink for AECI. Major and minor roads are shown for reference, helping residents and stakeholders identify service areas and infrastructure.
The disparity is striking. Approximately 81% of white residents in Cape Town live in a city-supplied region, compared to only about 27% of black Africans. This discrepancy, a legacy of apartheid-era urban planning, highlights how historical and present-day inequalities are perpetuated by existing infrastructure. The city deserves credit for using its hydroelectric plant and distribution infrastructure to mitigate load shedding and save lives. However, it's clear that this approach also reinforces historical disparities. From the tragic death of young Neyemiah James to Yengiwe Mthimunye, who was turned away due to a power outage, these cases underscore the urgent need for sustainable energy solutions in South Africa.
This is a substantially revised version of an article previously published in the SALDRU Newsletter entitled 'Less loadshedding? Fewer deaths'.
Joshua Budlender is a Postdoctoral Research Fellow at the SA-TIED programme.
The views expressed in this piece are those of the authors, and do not necessarily reflect the views of the Institute or the United Nations University, nor the programme/project donors.